
by Fred Beach Monday, April 15, 2013
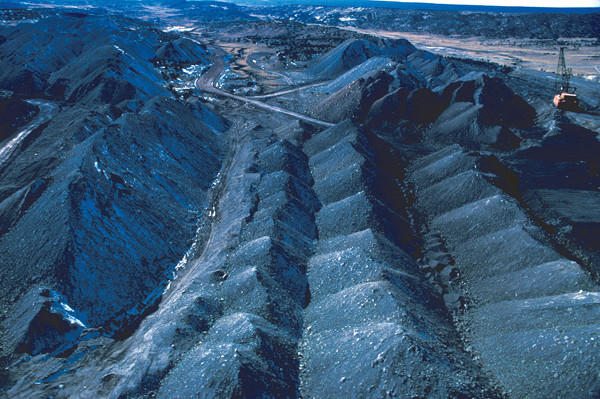
The U.S. is the world's third-largest petroleum producer, second-largest coal producer and largest natural gas producer. Copyright Michael Collier, ESW Image Bank
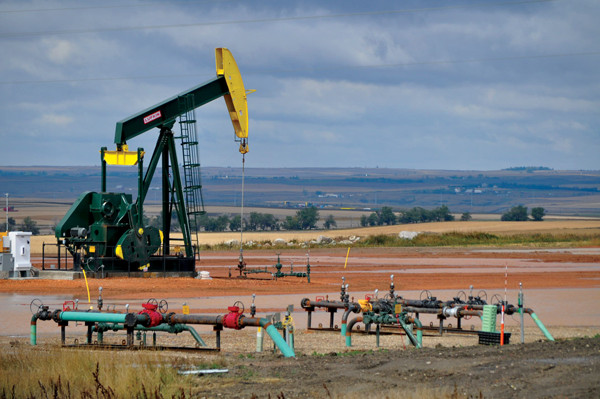
The U.S. is the third-largest oil producer worldwide, but our demand far outstrips our production. ©porchlife, Creative Commons Attribution-NonCommercial-ShareAlike 2.0 Generic
The Keystone XL pipeline might resemble the TransAlaska Pipeline (above). Most of it would be aboveground and would carry oil from Canada to the Gulf of Mexico. Copyright BP p.l.c.
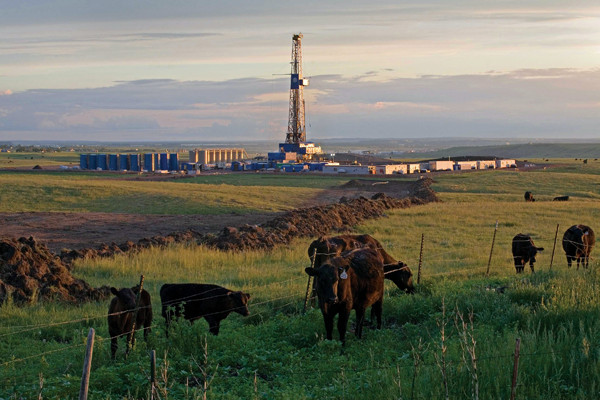
The sharp increase in U.S. natural gas production, beginning in 2008, was driven by exploitation of shale gas formations such as the Bakken shale formation in North Dakota and Montana through the combined technologies of horizontal drilling and hydraulic fracturing. Statoil

Author Fred Beach courtesy of Fred Beach
In recent years, every time an election has rolled around, politicians have espoused the necessity of energy independence and energy security. According to them, if we are to achieve the necessary level of energy security we need to “drill, baby, drill,” develop “clean coal,” install new pipelines, develop renewable energy, make sure our cars get better gas mileage, or [fill in another sound bite of your choosing here]. A listener could easily conclude that the U.S. lacks energy security. But what do the numbers tell us about our current state of independence? And is the political sloganeering grounded in fact, or does it ignore how much our situation has changed already?
From the time the United States was founded through the last years of World War II, the country was nearly 100 percent energy independent. Electricity came from coal- and oil-fired power plants and a series of massive hydroelectric dams. We had historically produced more petroleum than we used, resulting in our being a net petroleum exporter. However, the explosive growth of our economy following the war and the associated demand for energy (particularly in transportation) outstripped our growth in energy production.
By the second half of the 20th century, our growing demand for electricity resulted in a nationwide electric grid served by central power plants fueled not just by domestic coal and hydropower, but also by a growing portion of nuclear energy and natural gas. Petroleum had become too expensive to be burned for producing electricity and was used principally for transportation. We were still able to meet most electric power needs domestically, but by 1972, when U.S. petroleum and petroleum liquids production peaked and began a steady, and many thought permanent, decline, we were beginning to import more and more petroleum to fuel our swelling transportation sector.
By 1998, the U.S. was importing half of its petroleum. In 2005, U.S. petroleum imports reached 60 percent of our national consumption and 18 percent of natural gas. Both were all-time highs and combined to result in another record that year as well: Fully 31 percent of total energy consumed in the U.S. came from imported sources.
Just six years later, however, petroleum imports dropped back down to 46 percent, natural gas was down to 6 percent and U.S. dependence on imports for total energy consumption was down to 19 percent.
The trend in increasing energy dependence had not only stopped but had reversed direction in less than a decade. Furthermore, forecasts by the U.S. Energy Information Administration (EIA) predict that by 2035, petroleum liquids imports will have declined further, to 36 percent of consumption; the U.S. will be a net exporter of natural gas; and imports for total energy consumption will be down to 13 percent.
What happened? What does it mean for the U.S. economy and for international relations? Or does it really make any difference at all?
The world’s current supply of energy is dominated by the “Big Three”: petroleum, coal and natural gas. We may aspire to a clean energy future, but for the time being, 87 percent of the world’s energy and 82 percent of our nation’s energy comes from these three fossil fuels. Consequently, domestic resources of fossil fuels heavily influence the degree to which a nation can achieve energy independence.
There are exceptions to the Big Three dependence. Norway, with a small population and large hydropower resources, obtains 98 percent of its electricity from hydropower. The country’s North Sea oil and gas resources fulfill their remaining energy needs while also positioning Norway as the world’s second-largest natural gas exporter and Europe’s largest oil exporter. But Norway isn’t just an exception; it is an anomaly. Then again, so is the U.S.
The U.S. is the world’s third-largest petroleum producer, second-largest coal producer and largest natural gas producer. (We are also number one in nuclear energy generation and number two in wind power generation.) Unfortunately, we are also the world’s largest petroleum and natural gas consumer and second-largest coal consumer. It seems that our achievements in energy production are only exceeded by our achievements in energy consumption.
If the U.S. has an Achilles heel in terms of energy security and energy independence, it is petroleum. While the U.S. is the third-largest producer worldwide, our demand far outstrips our production. In fact, until recently, U.S. demand even exceeded the production capacity of the two largest global producers — Saudi Arabia and Russia — combined. But that has changed. Our demand dipped starting in 2005, and the drop-off then accelerated further due to the economic downturn. In addition, during this same period, our production began to increase. By 2011, the U.S. was still the third-largest producer, but domestic production had posted its fourth year of steady growth after nearly three decades of decline.
The bulk of the increase has come from accessing “tight oil” in formations that were previously deemed cost-prohibitive for production when oil sold in the $20 to $40 per barrel price range from the 1980s to early 2000s. The surge of oil prices above $40 per barrel starting in 2004 led oil producers to begin working to access these tight oil deposits. New supply began reaching the market in 2008 and has been increasing every year since. Much of this work in tight oil has occurred in the Bakken shale formation of North Dakota and Montana. But there are several similar formations in the U.S., such as the Eagle Ford shale in southern Texas, that are in early stages of development.
By 2015, if current production trends continue, the U.S. could surpass both Saudi Arabia and Russia to become the world’s largest producer of petroleum liquids. Of course, we won’t become a net exporter, but as our production grows faster than our demand, the amount and percentage that we import will steadily decrease.
That decrease won’t be evenly distributed across all import sources: Consumption of petroleum from Canada, our largest foreign source, should rise over time. Canada plans to continue developing its oil resources, and new pipeline infrastructure is being built that will essentially “lock in” much of that supply to the U.S. Our second-largest foreign source of petroleum is Mexico, which has large reserves, in spite of recent decreases in production.
Thus, the decrease in imports will likely occur in the most distant sources (which have the highest transportation costs) such as Saudi Arabia, Iraq and Nigeria. The net effect would be that Canada, which supplied 23 percent of U.S. petroleum imports in 2011, might provide 43 percent by 2035. Over the same period, oil from the Persian Gulf could drop from 16 percent of our imports today to just 12 percent, meaning it would account for an almost negligible 4 percent of our overall consumption.
Of course, production and consumption projections for petroleum are challenging and represent best guesses. Forecasting production is perhaps easier, as it is based on exploration that has already been conducted and on infrastructure projects that have already commenced, even though they may take several years to bear fruit.
Consumption projections are heavily dependent on consumer behavior, such as how much we drive, which is difficult to predict. Private vehicles account for 62 percent of our petroleum demand and transportation as a whole for more than 70 percent. When gasoline prices increase significantly, people tend to drive less, so consumption goes down. In addition, when prices increase significantly and stay high, politicians and the public call for more efficient vehicles. For projections from now through 2035, EIA’s data rely on an average consumer’s annual amount of driving and a 40 percent increase in the fuel efficiency of light-duty vehicles. Of course, a stronger consumer movement toward more fuel-efficient vehicles could cause the slow forecast growth in consumption to flatten or even decrease. Additionally, a more rapid adoption of electric and/or natural gas vehicles could also reduce consumption and further reduce petroleum imports.
It has often been said that the U.S. is the Saudi Arabia of coal. With the world’s largest coal reserves, the U.S. has more than 240 years of supply based on current production. What is new is that even though U.S. coal consumption has been in a slow decline since 2007, production has remained roughly constant. That is because our net coal exports have doubled since 2005. For decades, the U.S. has exported metallurgical coal, used in steel production. The recent growth has been in the export of thermal coal for electricity production, the very segment of consumption that is in decline in the U.S.
Europe has traditionally been the primary customer for U.S. thermal coal. But in 2009, the increased demand for U.S. coal in Europe was matched by demand growth in China. China is the world’s top coal producer, but also the top consumer. In 2010 and 2011, China consumed as much coal as the rest of the world combined. And these years were no anomaly. Despite the global economic downturn, China’s coal consumption has been growing at an average annual rate of 10 percent since 2001. China has large reserves of coal, but their consumption is so great that they could be exhausted in a little more than 30 years.
Aging coal-fired power plants in the eastern and central U.S. have already begun to be retired, and the pace of this scale back is predicted to increase. Their electric power output will be replaced by a combination of natural gas-fired power plants, wind generation and possibly nuclear plants. The Appalachian coal production that fueled these retiring plants will continue to shift toward export, via Atlantic and Gulf of Mexico ports, to meet the growing demand in Europe and South America.
Logistics and transportation costs favor meeting the growing Asian coal demand with coal from the Powder River Basin in Wyoming and Montana, the largest deposit of low-sulfur subbituminous coal in the world, which is typically used in power plants. In late February, the U.S. Geological Survey released its first-ever assessment of the entire basin, estimating it holds a total of 1.07 trillion short tons of coal, with 162 billion short tons of it currently being economically recoverable.
Permitting of new and expanded coal export terminals in the Pacific Northwest ports of St. Helens and Coos Bay in Oregon and Bellingham, Longview and others in Washington are in progress — although highly controversial. In spite of the economic benefit of exporting coal from these ports, there is strong environmental opposition for a variety of reasons. It is not clear whether environmental or financial concerns will prevail. However, there is little doubt that the growing demand for coal in China, South Korea, Japan and other Asian countries will continue.
In the U.S., the fossil fuel story that has grabbed the most media attention in the last several years is the rapid growth in domestic natural gas production. U.S. natural gas production was roughly steady between 18 trillion and 19 trillion cubic feet (TCF) per year for two decades. The sharp increase in production, beginning in 2008, was driven by exploitation of shale gas formations through the combined technologies of horizontal drilling and hydraulic fracturing. Both technologies have existed for several decades, but their use in tapping narrow horizontal layers of gas-bearing shale was spurred in part by a natural gas price increase that began in 2000.
The lag between the increase in the price of natural gas (in 2000) and the increase in production (in 2008) demonstrates the time required to bring a new resource to market on a large scale. The near-simultaneous rise in natural gas and petroleum production is not a coincidence. Both were driven by price increases that spurred exploration and production in hydrocarbon formations that were cost prohibitive to produce at the prices of the preceding decades. The increase in petroleum production also supports natural gas production, as many oil wells also produce associated gas that can be captured for sale. Likewise, many natural gas wells also produce gas condensates, or “wet gas.” These petroleum liquids contribute to the nation’s petroleum production numbers and help make these natural gas wells profitable even with low natural gas prices.
If, or when, the U.S. becomes a net exporter of natural gas depends primarily on U.S. demand growth. However, the degree to which the U.S. can export natural gas is heavily dependent on export-capable infrastructure. The U.S. has about a dozen liquefied natural gas terminals built for import. Three of these are in the process of being converted to serve as export terminals, with a combined potential capacity of approximately 2 TCF. The extent to which the export infrastructure expands will be driven by the interaction between domestic and overseas demand.
The U.S. is now the world’s largest producer of natural gas, and is poised to become the world’s largest producer of petroleum within the next five to 10 years. In the grand scheme of energy independence, becoming the largest producer of petroleum and natural gas is probably a good thing, as we will likely continue to be the world’s largest consumer of both for at least a few more years. Coincident with this, global coal consumption is growing the fastest of all three fossil fuels, and the U.S. has the world’s largest reserves. Growth in overseas coal demand, coupled with a reduction in domestic demand, seems to indicate that our exports of coal will increase. China’s coal production is three times that of the U.S., so it is unlikely that the U.S. will achieve a fossil fuel production trifecta, but our number two position in coal production will likely continue unchallenged.
All three of these macro-trends in fossil fuel production support a steady reduction in U.S. net energy imports and therefore an increase in U.S. energy independence. Our energy consumption-to-production gap might close over time, meaning imports could account for as little as 13 percent of consumption by 2035, based on EIA projections. The production forecasts might carry a bit more veracity than the consumption figures, but the direction of the trends is likely correct. Growth of U.S. consumption of fossil fuels is slowing and even declining (especially for coal), while the world’s as a whole is growing. And while our production of all three is steady or increasing, the world’s production is doing all it can to keep up.
However, just what increased energy independence means for the U.S. is unclear. From a security standpoint, reduced reliance on imported petroleum would seem to portend a reduction in our national security interest and involvement in the Middle East and the Persian Gulf states in particular. This probably wouldn’t sit well with U.S. allies such as Japan and South Korea, which will still be almost wholly dependent on Middle East oil and on our historical involvement in keeping it flowing to them. Taken to a not unrealistic extreme, the fossil fuel resource wealth of Canada, the U.S. and Mexico could allow the North American continent to create its own energy cartel. This would potentially allow North America to not just set its own price for oil, but to decouple itself entirely from the erratic global energy market and to stabilize oil, gas and coal prices in North America, thereby providing the continent with a huge economic advantage.
From a more pedestrian economic perspective, it would seem to be good to reduce our energy imports and increase our exports. This would help with our international balance of trade while bolstering domestic employment. With a major trade partner like China, for example, given that we are dependent on them for their products, it might be good to be in a position of having them more dependent upon us to supply the energy resources needed to manufacture those products and grow their economy.
However, history has shown that being more energy independent is not always good for us economically. It was during our time of greatest energy dependence, from 1995 to 2005, that the U.S. economy experienced some of its greatest growth. This might be explained at the macro-level as the result of the relatively low global cost of energy during those years fueling the growth in consumption and productivity in the U.S. Or put another way, when the global cost of energy was low, we bought more of it from others, and now that it is high, we are making a shift toward buying less abroad and producing more domestically.
The importance of national energy independence for the U.S. is also confusing when the situations of other major countries are considered. For example, of the countries in the G8 — the Group of Eight, which have the largest economies in the world (not including China and Brazil) — only Canada and Russia are net energy exporters, that is, 100 percent energy independent. Regardless of how similar in energy independence the two may be, however, they couldn’t be more different in how they employ this “advantage” via international relations. Likewise, although both Japan and Italy are more than 80 percent dependent on imports for their energy, the health of their economies and influence in international affairs are very different. Finally, even though Germany already imports more than half of its energy, the country seems comfortable in making energy policy decisions that could make it even more dependent (such as deciding to shutter their nuclear power plants over the next several years).
The future is never clear, but trends in energy production and consumption at the national level do not change quickly. The recent reversal in the U.S. energy balance from four decades of increasing dependence to growth in independence was more than a decade in the making and required concurrent shifts in U.S. production and consumption trends of all three fossil fuels.
But now that the change has occurred, it helps paint the broad strokes of what the next few decades of energy production and consumption might look like. What remains to be seen is whether we will harness this growth in domestic energy development and increase our energy independence to strengthen our economy and bolster our international footing, or if we will squander it away.
© 2008-2021. All rights reserved. Any copying, redistribution or retransmission of any of the contents of this service without the expressed written permission of the American Geosciences Institute is expressly prohibited. Click here for all copyright requests.