
by Lucas Joel Wednesday, November 15, 2017
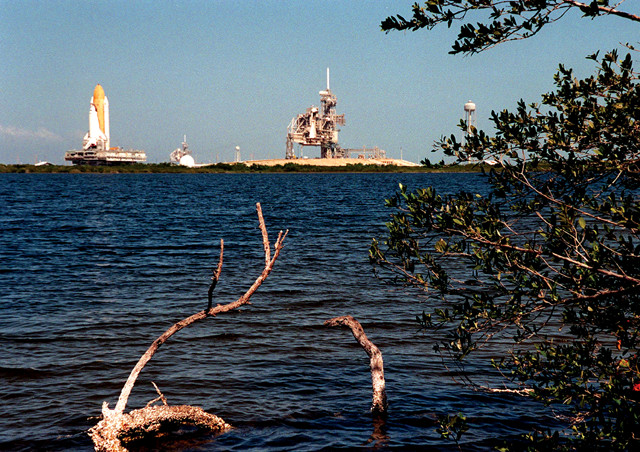
Researchers first uncovered hints of a sea-level rise hot spot along Florida's coastline in 2011 in the Indian River Lagoon, pictured here. Credit: NASA.
As sea levels creep up around the world, scientists have observed hot spots where regional rates of sea-level rise greatly outpace the global average. But what drives the formation of these hot spots, and how long they last, have been mysteries. In a new study, scientists tracking sea levels along the Florida coast suggest that the combined effects of two naturally occurring climate processes, the El Niño-Southern Oscillation (ENSO) and the North Atlantic Oscillation (NAO), control sea-level hot spot formation along the U.S. East Coast.
Arnoldo Valle-Levinson, a climate scientist at the University of Florida and lead author of the new study in Geophysical Research Letters, and his colleagues found that beginning in 2011, water trapped in sediments in the Indian River Lagoon near Melbourne, Fla., started getting saltier due to seawater infiltration. NOAA tidegage data collected between 2011 and 2015 then also revealed something striking: a sharp increase in sea level in the lagoon. Instead of the surface rising at about 2 millimeters per year — the global average at the time; today, this average is about 3 millimeters per year — it was rising at about 2 centimeters per year.
Tidegages in Fort Lauderdale and Miami “showed exactly the same thing,” Valle-Levinson says. “There’s the same rapid increase all the way from the Florida Keys to the stations in North Carolina.” The pattern suggested a sea-level rise hot spot along the Southeast coast — something similar to what other researchers have seen farther north on the coast.
Looking at a wider view of sea-level data up and down the East Coast since 1920, the team found that hot spots — typically lasting three to five years — can occur simultaneously along the entire coastline, or they can seesaw back and forth, from north to south. To figure out why the hot spots happen, he says, “we started looking at the forces that alter the oceans and the atmosphere and that can cause the ocean to pile up [in places] … wind and air temperature and water temperature and atmospheric pressure.”
The team found that the timing, locations and magnitudes of hot spots correlate with ENSO and NAO, both multiyear climatic processes that can have far-reaching effects on the climate and the oceans. ENSO cycles occur every two to seven years when the tropical waters of the western Pacific Ocean warm. This extra heat impacts weather in western North America, as well as on the other side of the country. “During El Niño, there’s a change in wind patterns in the North Atlantic that will cause modifications to the water levels,” Valle-Levinson says. Similarly, changes in the NAO — which affects atmospheric pressures between Iceland and the Azores — can also influence hot spot formation by altering wind patterns and causing sea levels to rise and fall along the East Coast, he explains.
Hot spots like the one Valle-Levinson and his team discovered are superimposed on top of the sea-level rise already taking place as a result of global warming. This is important information for city planners in coastal areas at risk of inundation due to sea-level rise, says Larry Atkinson, a coastal oceanographer at Old Dominion University in Virginia who was not involved in the work. Stormwater managers consult sea-level rise forecasts, “and they need to know what the lower and upper bounds” of these forecasts are, he says. Having such information can help managers decide, for instance, how much money to spend on things like water pumps that help divert water around cities, he says. “They usually call [me] after a paper like this comes out” to ask if their forecasts should be updated, “and in this case, I would say, ‘Your upper bound just got a little higher.'”
But when it comes to predicting exactly where and when future hot spots will occur, Valle-Levinson says there are still not enough data: “We need at least three more life spans [about 70 years each] of data to see whether what we say is [useful] for predictive purposes,” he says. “With three cycles we’d be able to tell if the variation is cyclical. One cycle is not enough to tell whether it is repeatable, and two cycles may indicate repeatability but might not be enough” to gauge cyclicity. Regardless, he says, when it comes to hot spots, it’s clear that “sea level won’t creep up to communities and municipalities slowly — it will come up in rapid bursts.”
© 2008-2021. All rights reserved. Any copying, redistribution or retransmission of any of the contents of this service without the expressed written permission of the American Geosciences Institute is expressly prohibited. Click here for all copyright requests.