
by Andrea Watts Monday, June 30, 2014
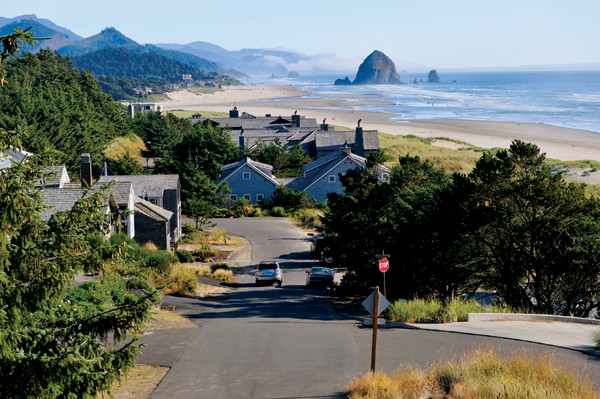
Most people living along the coast in California, Oregon and Washington are aware of the earthquake and tsunami risk posed by the Cascadia Subduction Zone just offshore. Credit: ©iStockphoto.com/4FR.
Once overlooked because of its relative inactivity compared to other subduction zones around the world, the Cascadia Subduction Zone (CSZ) — and the potentially devastating megathrust earthquakes and tsunamis it could unleash — are today well known to both geoscientists and the public.
Beginning with the efforts of John Adams of the Geological Survey of Canada and Brian Atwater of the U.S. Geological Survey in the late 1980s, a series of oceanic research cruises and datasets has steadily advanced our understanding of Cascadia. It seems like there is “a paradigm change every few years,” says Chris Goldfinger, a geologist at Oregon State University. And just when we think we have nothing startling left to learn about this subduction zone, he says, something “startling” emerges.
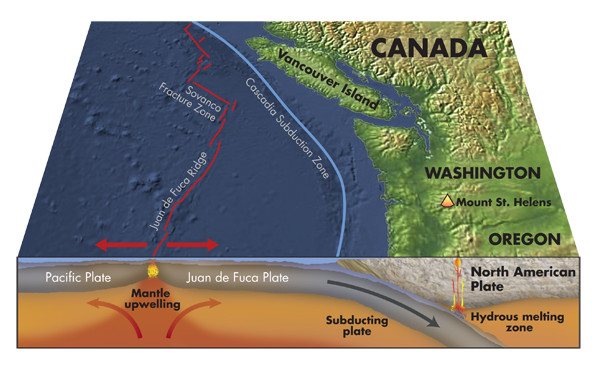
The Cascadia Subduction Zone is a 1,000-kilometer-long subduction zone stretching from Mendocino, Calif., to north of Vancouver Island off the coast of British Columbia. It is capable of producing magnitude-9-plus earthquakes. Credit: Kathleen Cantner, AGI.
One thing scientists studying Cascadia do know for sure is that such massive quakes have occurred here before, and they will happen again.
Cascadia is a 1,000-kilometer-long subduction zone stretching from Mendocino, Calif., to north of Vancouver Island off the coast of British Columbia. Those living along this stretch are occasionally treated to some shaky moments by the subduction of the Juan de Fuca Plate beneath the massive North American Plate. The process underlies the volcanism of the Cascades — resulting in well-known peaks like Mount St. Helens and Mount Rainier, among others — and causes a variety of seismic vibrations, from episodic tremor and slip events unfelt on land to larger earthquakes such as the deep, magnitude-6.8 Nisqually quake in 2001 that damaged the Washington State Capitol in Olympia. The last “big one,” which ruptured along the fault’s entire length, struck in 1700, and recent research suggests that the return interval for such magnitude-9 megathrust events is roughly every 400 to 600 years.
Much research into the CSZ is underway because of the hazard presented by a future megathrust earthquake. Scientists are focusing on everything from how heat and fluids flow through ocean-bottom sediments near the subduction zone to how seafloor topography affects plate subduction, and from what old lake sediments on land show about previous quakes to how best to communicate earthquake preparedness. Although not all studies contribute directly to answering the question of when or where the next big earthquake will occur, they are helping elucidate the overall picture of just what is happening off the Pacific Northwest coast.
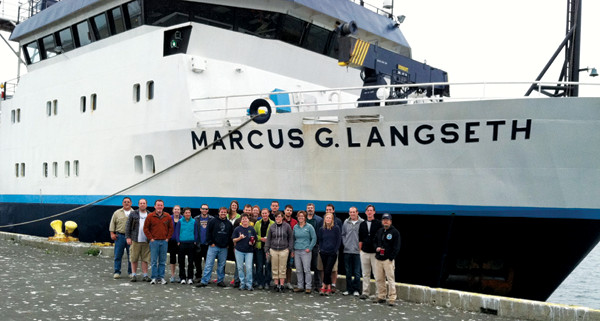
The science team aboard the R/V Langseth prior to sailing in July 2012. Credit: Lamont-Doherty Earth Observatory.
Seismic and bathymetric data are important for studying the subducting Juan de Fuca Plate, and although datasets exist off the Oregon coast, they were not available off the Washington margin until the United States Navy lifted its restriction on seismic data collection less than 10 years ago. During the 2012 National Science Foundation (NSF)/GeoPRISMS-funded cruises, researchers collected seismic images along two transects, 450 and 300 kilometers long, with one transect reaching near the Oregon coast close to Astoria, and the other offshore of Washington’s Grays Harbor, respectively. Scientists hope these new datasets will both reveal the Juan de Fuca’s structure and yield insights into the subduction process. And with synthesis of the results nearing completion, researchers have found previously unknown features of the Juan de Fuca Plate that offer a new view of Cascadia’s water cycle.
Understanding how water cycles through the downgoing plate is important because water plays a key role in the earthquakes and volcanic processes associated with subduction. Its expulsion from crustal or upper mantle rocks is hypothesized to contribute to earthquakes occurring within the subducting plate, such as the Nisqually earthquake, and to melting of the mantle above the plate, which eventually generates the magmas that erupt at the surface.
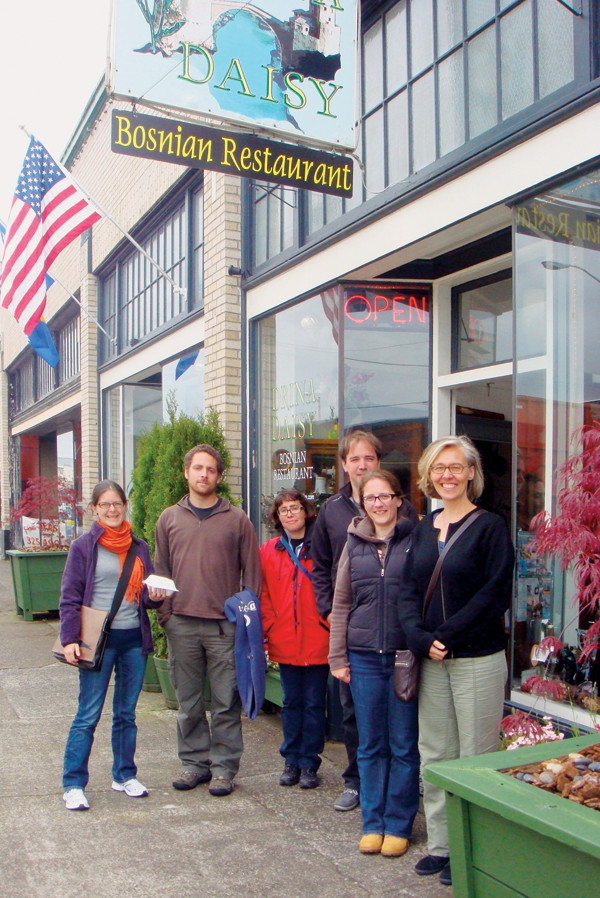
Researchers explore Astoria, Ore., prior to heading out on a cruise in June 2012. Credit: Suzanne Carbotte.
The Juan de Fuca Plate is relatively young, hot and buoyant, so researchers assumed the plate would not exhibit extensive faulting in its crust near where it begins dipping beneath the North American Plate — an area known as the deformation front. But initial results reveal that the plate shows behaviors characteristic of subduction zones with older and colder subducting plates, says Suzanne Carbotte, a geophysicist at the Lamont-Doherty Earth Observatory at Columbia University, who served as chief scientist on the June 2012 cruise aboard the R/V Langseth.
“We’re seeing evidence for faulting in the Juan de Fuca Plate as it is beginning to bend into the subduction zone,” Carbotte says. And because the faults approaching the deformation front are found to transect the entire plate through the crust and into the mantle, the data appear to indicate that there are pathways for water to reach the upper mantle prior to the plate subducting. These new datasets support older data that suggested bend faulting occurred in the sediments covering the plate, she says, but it was unknown how far the faulting extended into the crust and mantle and whether significant hydration of the plate accompanied this faulting.
Not only does it appear that water may be entering the plate, there is also evidence of its expulsion. The recent seismic imagery also revealed previously unknown pockmark-like circular depressions on the seafloor off the Oregon coast. If these structures are pockmarks, which result from fluids moving through the sediments beneath the seafloor, Carbotte says they provide evidence for the migration and venting of fluids from the Juan de Fuca Plate before it reaches the deformation front.
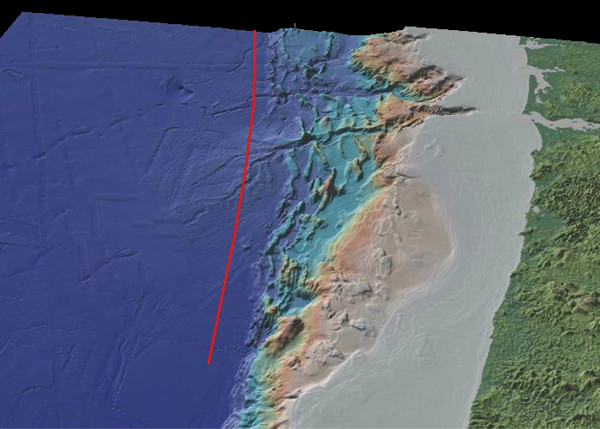
Bathymetry map showing the deformation front where the Juan de Fuca Plate starts diving beneath the North American Plate. The red line shows part of the transit the June 2012 cruise took. Credit: Suzanne Carbotte.
Studying the water budget, as well as the movement of heat, through the thick layer of sediments on the Washington margin of the CSZ may in turn suggest clues about the locked part of the subduction zone. The locked zone is the portion of the CSZ where friction prevents the colliding plates from moving. Yet the subduction process is not halted entirely and continues, building strain until the friction gives way and a large earthquake results. Risk assessment and hazard preparedness depend on identifying the size and position of the locked zone on the Washington margin. The location of the locked zone affects the outcome of a quake — the more landward the locked zone, the greater threat of structural damage on land, whereas a more seaward zone has the potential to create larger tsunamis.
Scientists think that the extent of the locked zone off the Washington coast is correlated to the temperature of the incoming Juan de Fuca Plate: 100 to 150 degrees Celsius for the seaward limit and typically about 350 degrees Celsius for the landward limit. The estimated location of these temperatures off the Washington margin was based on heat-flow studies conducted in the northern section of the CSZ off Vancouver Island. H. Paul Johnson, a marine geophysicist at the University of Washington, wanted to confirm whether the estimated locked zone’s location matched its actual location through the use of heat-flow data. To collect this heat-flow data, he enlisted the aid of Evan Solomon, a marine geochemist and expert in fluid-flow dynamics in subduction zones, also at the University of Washington, on the August 2013 NSF/GeoPRISMS cruise aboard the R/V Atlantis.
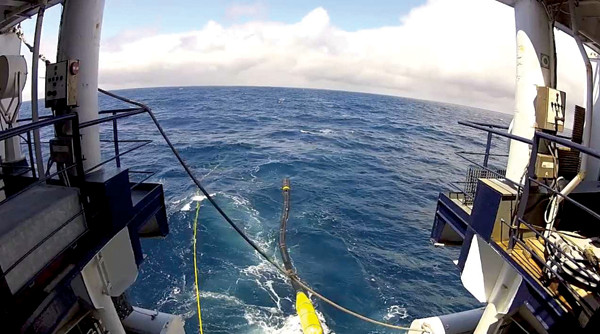
The team deploys the seismic airgun array on the 2012 cruise. When fired, the airgun sends pulses of sound penetrating through the Juan de Fuca Plate and into the upper portion of the mantle. After the sound waves are reflected off the mantle, they are received as echoes by the hydrophones being trailed behind the ship. Carbotte's lab is finishing processing these echoes to produce an image of the Juan de Fuca Plate. Credit: Greg Horning.
Heat travels through the sediments on the Washington margin via both fluid flow and conduction from the plate boundary. Surface heat-flow data from the seafloor can be used to extrapolate a thermal gradient down to the plate boundary, allowing scientists to then estimate temperatures on the plate interface. However, it is necessary to distinguish which of the two types of heat flow is being measured at the ocean bottom because heat travels at different rates depending on how it’s being transmitted. This, in turn, will affect the thermal gradient and any estimate of temperature on the plate boundary. Determining the locked zone’s location requires researchers to measure heat being conducted from depth rather than by fluid flow, Solomon says.
During the cruise, the team collected heat-flow data and other measurements from the 2,600-meter abyssal depths at the deformation front to the edge of the continental shelf. To distinguish how heat is being transferred to the seafloor, the team also collected independent fluid-flow rate measurements. Preliminary analyses of these heat-flow data revealed that the locked zone is narrower and farther offshore than originally estimated, suggesting that shaking during a future megathrust quake might be less severe on land but could generate a large tsunami.
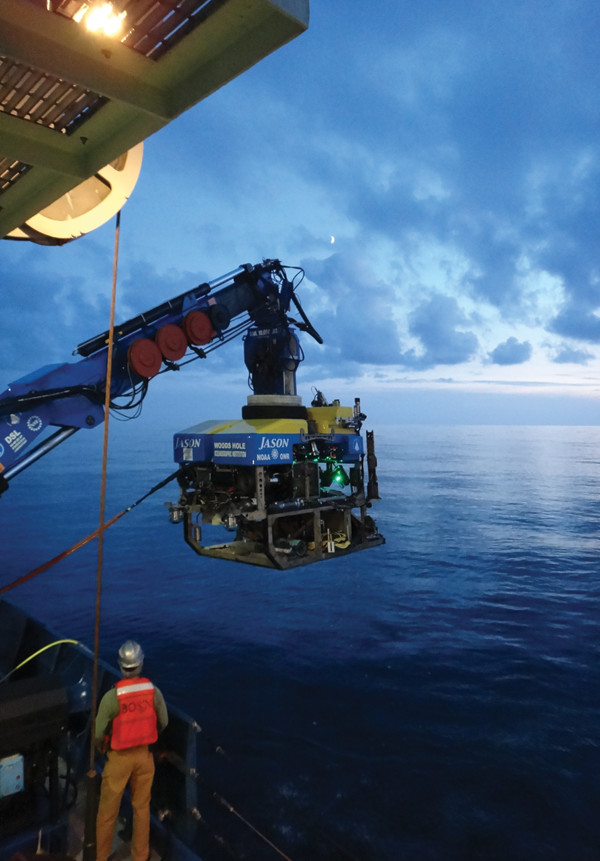
The Volkswagen-sized ROV Jason II vehicle, which is attached to a surface ship via a fiber optic cable and is used to deploy and recover instruments, is launched off the R/V Atlantis. Dives using the ROV can last as long as four days. Credit: H. Paul Johnson.
While Johnson and his graduate student Marie Salmi continue to analyze the heat-flow data, Solomon and his graduate student Rick Berg are pursuing a separate line of inquiry, using the fluid-flow measurements, into the movement and geochemistry of water percolating through the sediments on the Washington margin. Water’s expulsion from pore spaces in the sediment may contribute to the locking behavior of the subduction zone, Solomon says.
Smectite is a clay mineral commonly found in sediment columns at subduction zones; in addition to water in pore spaces, smectite contains water bound up in its crystal structure. As a sediment column enters a subduction zone, water is squeezed from the pore spaces, lubricating the plate’s movement. Above 60 degrees Celsius, structural water is released from the smectite and the mineral converts to illite. This conversion produces a significant amount of water up to 150 degrees Celsius — corresponding roughly to the temperature associated with the locked zone’s seaward extent — and the subsequent lack of water within the sediment contributes to the locking."
It is typically thought that the smectite-illite conversion controls the onset of seismic activity at other subduction zones. But on the Washington margin of the CSZ, Solomon observed that the conversion is completed relatively early on, very close to the trench, while fluid production remains ongoing. With the smectite-illite conversion reaction happening early in the subduction process, Solomon says there is a clear window into some of the reactions that are likely important drivers of fluid production and other reactions that may affect sediment strength. Using the collected pore water samples, it is possible to determine at what temperature the water was produced and what dominant reactions produced the water, he says. “With the [pore fluid] chemistry, we can start teasing out what other dehydration reactions are occurring and how much water can be produced from them and what influence they might have.”
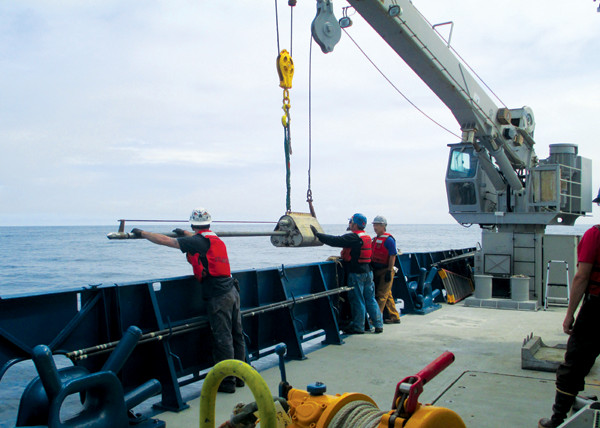
A heat-flow probe being deployed. Credit: Marie Salmi.
In addition to decreasing pore pressure as water is squeezed or otherwise lost from the plate interface, another contributing factor to the observed locking could be the presence of topographic roughness in the form of seamounts on the Juan de Fuca Plate. The role of seamounts in subduction is contested. Competing hypotheses hold that subducting seamounts could inhibit large earthquakes or that they could be sites where such quakes initiate.
Scientists have previously suspected there were seamounts off the Oregon continental shelf, and seismic images collected during Carbotte’s June 2012 R/V Langseth cruise revealed definitive evidence of a subducting seamount just seaward of the deformation front, west of the Oregon margin. On a subsequent two-week research cruise off the Washington margin in July, another seamount, buried deep below a thick layer of sediment, was discovered.
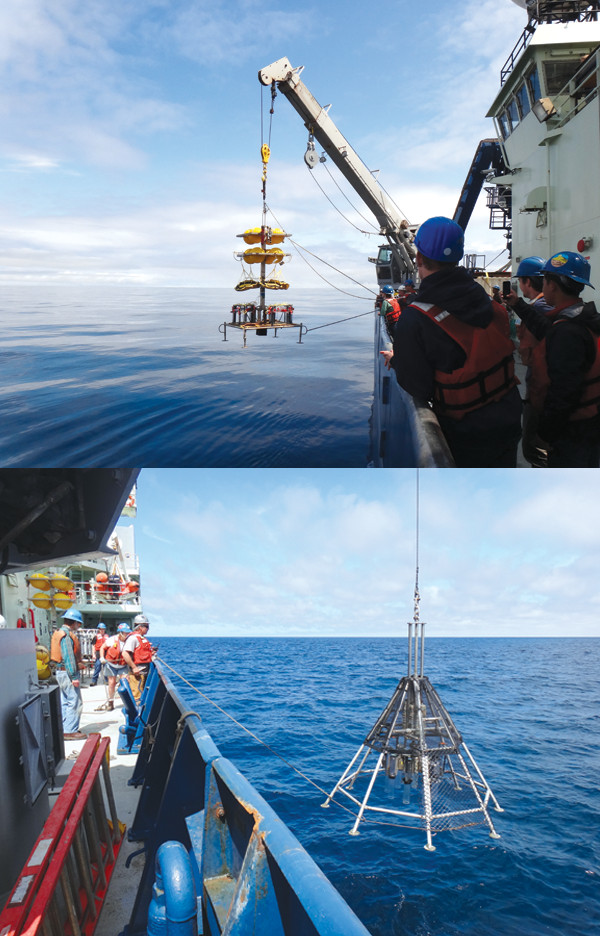
Deployment of multiple instruments from the R/V Atlantis on the 2013 cruise. Credit: both: H. Paul Johnson.
Jackie Caplan-Auerbach, a seismologist at Western Washington University, thought that gravity data could be used to infer locations of other seamounts. The most recently discovered seamount was assumed to have a composition of dense basalt and expected to yield a noticeably higher gravitational signal than the sediment burying it. Instead, “something that we think should be a pretty rigid, dense lump of rock doesn’t show up in the gravity data,” she says. This could be because the seamount is hydrothermally fractured and altered, or composed of clays instead of basalt, or perhaps the seamount formed on young crust and then sank into the crust. The result suggests that other methods, such as magnetism, are required to identify other seamounts within the system, Caplan-Auerbach says.
Seamounts are just one element of the structure of the CSZ. The “three-dimensionality of the structure [in these areas] is more significant than we recognized earlier. There is a lot of heterogeneity in the structure,” says Anne Trehu, a marine geophysicist at Oregon State University. “By mapping out the structures in Cascadia, we should be able to better anticipate where slip will occur and how the grounds will shake in a future large earthquake,” she says.
Trehu is investigating whether a relationship exists between this structure and how the earth will behave in the next big earthquake. Working with the 2012 cruise data from both Oregon and Washington, her team is mapping the heterogeneity and comparing it to “relationships between structure and slip during large earthquakes that have happened elsewhere,” she says.
Off Oregon, the North American Plate is composed of igneous rock in the region where large earthquakes could potentially occur, whereas the analogous region off Washington is composed of sedimentary rocks, with a crystalline, hard-rock crust not appearing until farther inland. The difference appears to have an effect on the dip angle of the subducting Juan de Fuca Plate. By better understanding the crustal structure, scientists hope to explain how the heterogeneity is affecting observations of strain accumulation and GPS data, as the observations are currently not fitting the models exactly, she says.
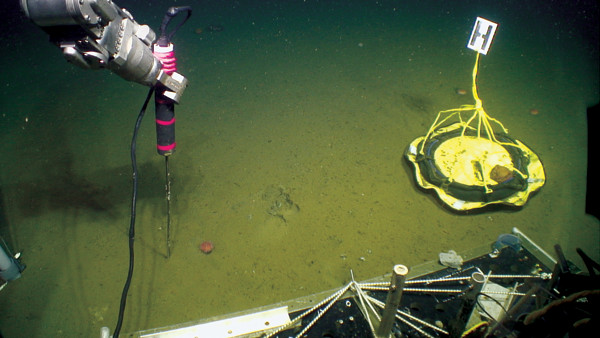
A still from a video from the ROV Jason, showing a heat-flow probe (left) in Jason's manipulator arm about to be inserted into the sediments. The yellow disk on the right is a thermal blanket that also measures heat flow. Credit: H. Paul Johnson.
Back on land at Oregon State University, Chris Goldfinger is working with turbidite records from inland lakes from Northern California up through Washington to assemble records of past earthquake records. Turbidites are sediment deposits that result from slope failures caused by earthquakes. Turbidites have proven invaluable in detailing past events and their magnitude over the past 10,000 years, as well as for estimating recurrence intervals and the likelihood of future events. But, Goldfinger says, “one of the problems that has cropped up over the years is that all the evidence we have for great earthquakes comes either from along the coast or far offshore, and all of our populated cities are well inland, so it gets hard to use the offshore data or the coastal data to make predictions about what’s going to happen in the inland cities.”
By knowing how much inland lakes were affected by past Cascadia quakes, scientists can get a better sense of the shaking that might be anticipated on land when the next great temblor happens. So far, early sediment samples contain deposits that can be linked to earthquake events represented in previously collected offshore and onshore samples, Goldfinger says, but he cautions that further analysis is still needed.
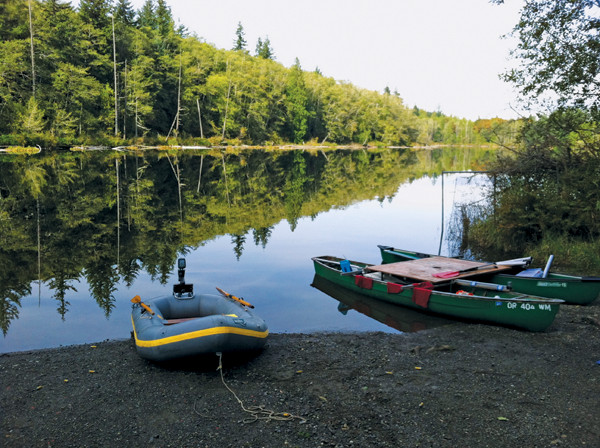
Chris Goldfinger and his team are working with turbidite records from inland lakes from Northern California up through Washington to assemble records of past earthquake records. Credit: Chris Goldfinger.
The hope, Goldfinger says, is that scientists will be able to use the turbidite data to put together a Peak Ground Acceleration map. Peak acceleration is basically a measure of how and how fast an earthquake moves through the subsurface, causing the ground to move, and is a value highly coveted by engineers who design buildings or develop building codes. As of yet, researchers have been unable to provide that value.
In the meantime, other researchers are working on how buildings and people will fare during a major quake. A new project at the University of Washington’s Pacific Northwest Seismic Network, called M9, is using supercomputers at the Department of Energy’s Hanford Site to construct models of how buildings and coastlines will react during an earthquake. The study brings engineers, seismologists and social scientists together to address earthquake preparedness. Engineers will use the results to study how the buildings react, and social scientists will determine how to communicate the findings of these simulations to the public and to assess what people may or may not know about earthquake preparedness.
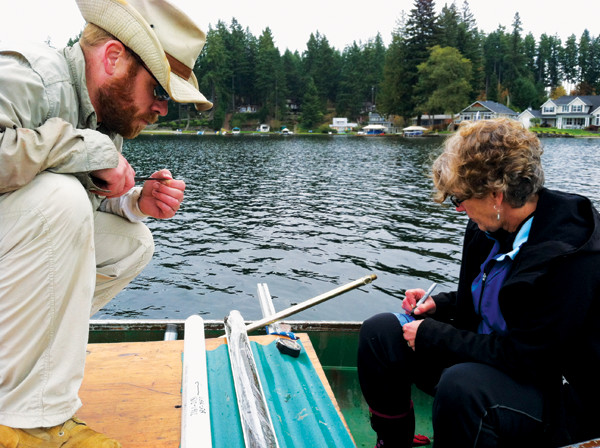
Graduate student Steve Galer and technician Ann Morey examine inland lake cores that contain turbidites. Credit: Chris Goldfinger.
John Vidale, a seismologist at the University of Washington and director of the Pacific Northwest Seismic Network, says the four-year project, which started last fall, is just gearing up. A meeting in April brought 15 agencies from Oregon and Washington together to hash out what information city and state emergency response managers, construction managers and transportation agencies need to prepare their respective departments.
To an extent, the M9 project — which focuses on the human impacts of a megathrust earthquake — closes the loop of Cascadia research that starts with raw data and moves to analysis and the production of sophisticated models on which building codes and earthquake preparedness can be built. And while researchers still can’t say for certain when the next megathrust earthquake will occur, they are motivated to find the answer, not only because of the intriguing questions to be answered, but because of the devastating societal impact a megathrust earthquake will cause.
Aboard the R/V Atlantis in 2013 off the Washington coast. Credit: Marie Salmi.
Although scientists are still analyzing the results of their recent data collection, they already have future projects in mind.
For example, Carbotte says, knowing that there are potential pathways for water to enter the Juan de Fuca Plate, the next step is to quantify how much water is being incorporated into the rocks and to create a detailed water budget for the plate. With the seismic images tracing the top of the subducting plate through a portion of the locked zone, Carbotte says, integrating her results with Johnson’s and Solomon’s heat- and fluid-flow data would make a great future project. Solomon cautions that recent insights regarding heat and fluid flow on the Washington margin are specific to the sites studied due to variability in sediment types and temperature along the length of the subduction zone. But he and Johnson agree that additional heat- and fluid-flow surveys off Oregon and Northern California would be worthwhile to help understand how the Washington margin compares to other portions along the margin.
Meanwhile, Vidale says that direct monitoring of the seafloor’s deformation would further our understanding of slow-slip events at the plate’s interface. Solomon says ocean bottom pressure recorders elsewhere, such as those placed off of Costa Rica, proved they are capable of recording these slow-slip events. And these recorders, he says, along with other seafloor instruments such as ocean bottom seismometers and flow meters could answer the question of whether slow-slip events occur in the offshore region of the subduction zone. They might even indicate the degree of locking along the plate interface farther offshore. What the unanswered questions of the Cascadia Subduction Zone demonstrate is that with earthquake research, there is no such thing as too much data collection. And as new researchers join in the task of unraveling the Cascadia Subduction Zone, even more questions will undoubtedly arise.
© 2008-2021. All rights reserved. Any copying, redistribution or retransmission of any of the contents of this service without the expressed written permission of the American Geosciences Institute is expressly prohibited. Click here for all copyright requests.