
by David Jacobson and Gabriel Lotto Wednesday, January 18, 2017
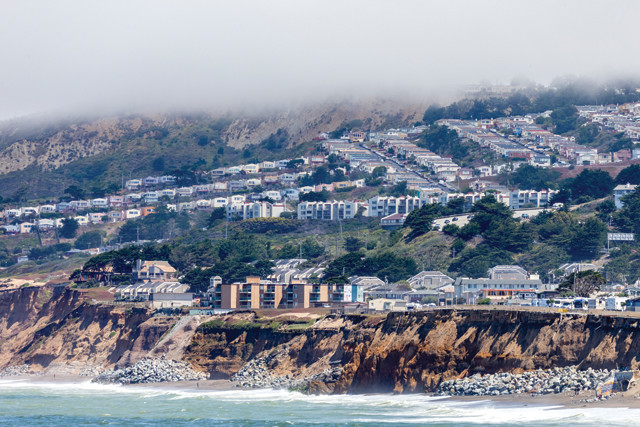
Fog blocking ocean views may be an occasional annoyance for homeowners in Pacifica, Calif., but they face far greater hazards from landslides caused by shaking on the nearby San Andreas Fault. Credit: ©iStockphoto.com/Spondylolithesis.
When a beautiful old house overlooking the Pacific Ocean — in Pacifica, just south of San Francisco — went on the market, Mike H., the seller’s real estate agent, sold it easily. Twelve potential buyers offered to pay more than the asking price. Perhaps unbeknownst to these eager suitors, however, the house sits about 200 meters from the San Andreas Fault within a mapped high-risk landslide zone.
Following the sale of the home, the company Mike works for tweeted about Temblor, a recently developed seismic safety app for homeowners and others living near potentially active faults. Hoping he and his colleagues had found a rare ally among real estate agents, the co-founder of Temblor, Ross Stein, asked Mike about the sale of the Pacifica property.
“Were there any issues with the sale of this home?”
Mike thought for a moment and answered, “Yup — Fog!”
Ross pressed Mike, “Were you concerned about the home’s location on a landslide in the San Andreas Fault zone?”
Mike’s self-contradictory response: “The shaking is lowest on the fault — and it’s all the same no matter where you live.”
How can real estate agents be so uninformed and homebuyers so oblivious — even when signing Natural Hazards Disclosure forms at closing?
Understandably, location (proximity to jobs, schools, parks and other desirable factors), home price, and aesthetics trump seismic safety for most homeowners. This is no surprise, given that large earthquakes are rare and many homeowners have never experienced strong shaking. Still, 143 million Americans live in areas of potentially damaging earthquakes — 28 million of those are in high-risk zones — and the population in these zones is growing 6 percent each year. Exposure to seismic hazard is increasing, but most people don’t have an understanding of the hazards they face.
Nevertheless, there is a serious thirst for seismic knowledge among the public. For example, Kathryn Schulz’s 2015 The New Yorker article, “The Really Big One,” won a Pulitzer for bringing national attention to the potential repercussions of a Cascadia megathrust earthquake.
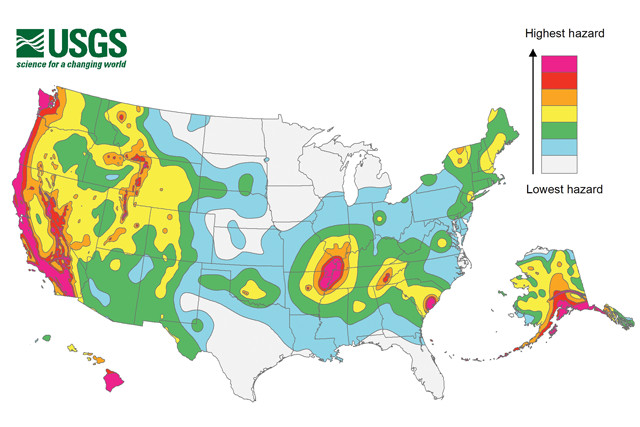
An estimated 143 million Americans live in areas susceptible to potentially damaging earthquakes, with 28 million people in areas considered to be at high risk. Credit: U.S. Geological Survey.
The U.S. Geological Survey (USGS) “is very effective at communicating with engineers, earth scientists and local governments,” Stein says. “But homeowners care about their home, their place of work, their children’s schools. And the language that matters to homeowners is dollars and safety.”
That’s why Stein, who spent 35 years at USGS researching earthquakes and communicating seismic hazard to the public, along with former USGS scientist Volkan Sevilgen, founded Temblor in December 2014 with the goal of making seismic resilience personal.
Temblor (www.temblor.net) is a web, iPhone and Android app that shows people their seismic hazard and explains the potential benefits of retrofitting an old home, buying a seismically safe new home and investing in earthquake insurance. Since hitting the App Store and Google Play in May 2016, Temblor’s interactive maps have received more than 150,000 views per month.
Before co-founding Temblor, Stein and Sevilgen worked together at USGS for seven years, developing the widely used “Coulomb” earthquake stress and deformation software and managing a probabilistic seismic hazard assessment for eight Balkan countries.
In August 2014, as part of a World Teacher Aid group, Stein traveled to Kenya to help open a school eight hours from Nairobi in the East African Rift Valley. Private donors funded the project, and a Kenyan nongovernmental organization selected the community, a village where people lacked even basic resources like roads and adequate freshwater. The new building would be more than just a school; for this community, it was a city hall, a granary, a cellphone charging station, and a symbol of hope.
“The school was beautiful, but to my horror I saw that it was built right next to an active fault scarp,” Stein says. “Could I be a bigger hypocrite? I had helped build a school that could kill the children if a quake struck.”
In fact, no one involved in constructing the school knew about the seismic hazard beforehand. Stein was determined not to let lack of knowledge be an excuse for future planning failures. “I realized that we had to make seismic risk information widely and freely available — on cellphones — if nothing more than to banish the excuse, ‘We didn’t know.'”
Stein came home and he and Sevilgen put together the first version of the app that fall.
The purpose of Temblor is to neither scare, nor soothe, its users. To that end, all of Temblor’s data comes from publicly available sources — predominantly state and federal geological surveys. Temblor’s co-founders believe that the neutrality and traceability of data sources will lend credibility, both among seismologists and the public.
Temblor is easy to use. Start a tour in, say, San Francisco. Typing “San Francisco” into the search bar reveals a map of the greater Bay Area, including local faults, both major and minor, as well as the USGS catalog of earthquakes from the previous 30 days (earthquakes from the last 24 hours appear red). Clicking an earthquake gives information about the quake, including magnitude, depth and time of occurrence. Those seeking additional information can click on a link that takes them to the USGS event page.
State geological surveys, USGS and private companies have produced numerous public reports that map secondary seismic hazards around the country. However, much of the data are either embedded in reports, or are only available as downloadable data files viewable in programs like ArcGIS, which makes them inaccessible to much of the public. In addition to showing faults and earthquakes, Temblor integrates this scattered hazard data into one self-consistent platform.
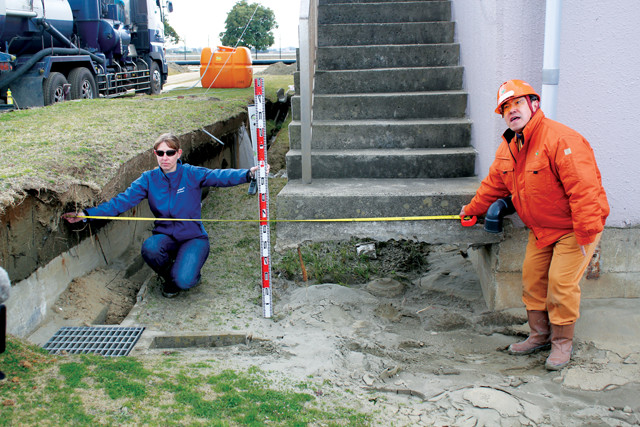
Liquefaction occurs when strong earthquake shaking causes water-saturated sediments to lose cohesion and behave like a liquid. Shaking from the March 2011 magnitude-9 Tohoku earthquake caused almost a meter of ground settlement at this water purification plant in Japan, which led to broken pipes and flooding. Credit: Scott Ashford, Oregon State University, CC BY-SA 2.0.
Surface manifestations of liquefaction can be quite dramatic. Examples include sand volcanoes, subsidence, and lateral cracking and spreading of the ground surface when a nonliquefiable layer is atop a liquefiable layer. While effects like these may be best known from Hollywood movies, they have also caused significant damage in recent earthquakes such as those in 2011 in Christchurch, New Zealand, and Tohoku, Japan.
Damage to homes, buildings, roads and automobiles from liquefaction was extensive during the magnitude-6.3 earthquake that struck Christchurch, New Zealand, in February 2011. A sand volcano, or sand boil, can be seen in the foreground. Credit: Martin Luff, CC BY-SA 2.0.
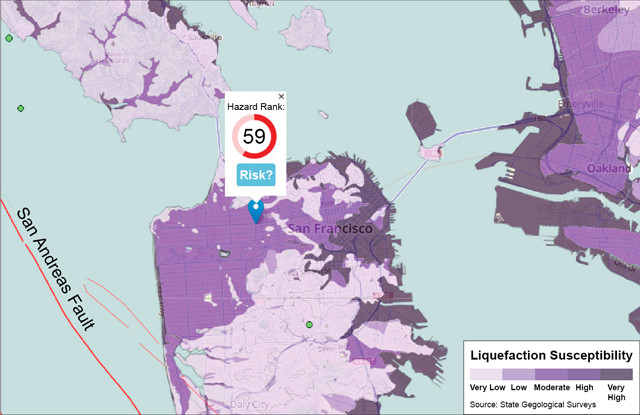
In the Temblor app, searching for an address or city — San Francisco, for example — brings up a map of the area that displays local faults as well as the U.S. Geological Survey catalog of earthquakes from the previous 30 days. Clicking an earthquake gives information about the quake, including magnitude, depth and time of occurrence. Other layers of information, such as the susceptibility to liquefaction, can also be overlain on the map. Credit: Temblor.net.
Selecting the “Liquefaction” layer in Temblor reveals that much of San Francisco, and the greater Bay Area, is susceptible to liquefaction damage. In fact, much of the Financial District, the backbone of many of San Francisco’s largest businesses, sits on artificial fill, which has a very high liquefaction susceptibility. This means that in the event of a large earthquake, much of the ground in this area could liquefy, rendering many buildings unusable. That is exactly what happened in areas of landfill during the 1906 San Francisco and 1989 Loma Prieta earthquakes. San Francisco’s 58-story Millennium Tower has sunk 41 centimeters and tilted 5 centimeters since its construction in 2008, possibly due to the same fill conditions that make the area susceptible to liquefaction. Given this potential hazard, knowing where the ground could become unstable is important for both homeowners and construction companies.
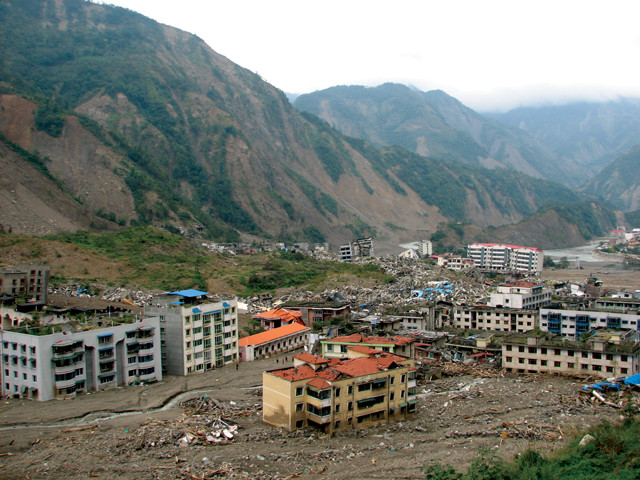
The town of Qushan in China was destroyed by shaking-induced landslides during the 2008 Wenchuan earthquake. Credit: Dave Wald, U.S. Geological Survey.
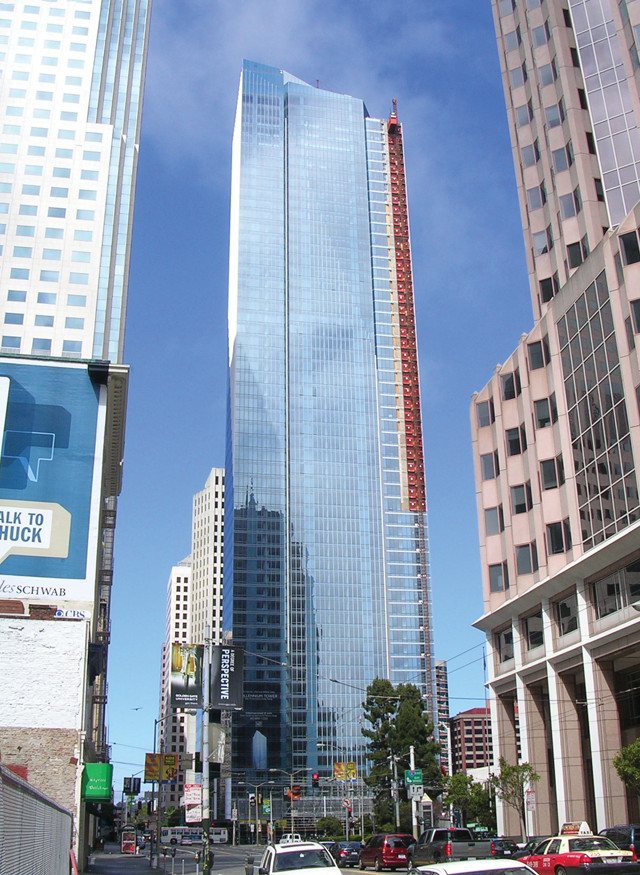
San Francisco's 58-story Millennium Tower has sunk 41 centimeters and tilted 5 centimeters since its construction in 2008, possibly due to the same fill conditions that make the area susceptible to liquefaction. Credit: Hydrogen Iodide.
Temblor also visualizes landslide hazard. In the May 2008 Wenchuan, China, April 2015 Gorkha, Nepal, and November 2016 Kaikoura, New Zealand, earthquakes, numerous landslides caused significant damage and loss of life. In addition, landslides can completely cut off towns by blocking roads and vital infrastructure, a problem observed following the recent New Zealand quake. To calculate landslide susceptibility, geologic surveys combine information about local geology and topography — areas with steeper slopes tend to be more susceptible, not surprisingly. Unfortunately for much of the Bay Area, the landslide hazard is high.
One of the most unique aspects about Temblor is its seismic hazard ranking system. For each location in the United States, a hazard rank between zero and 100 is calculated based on that location’s proximity to faults, likelihood of experiencing significant earthquake shaking, past earthquakes and soil conditions. Combining such data makes a user’s hazard rank highly location-dependent.
For example, despite San Francisco’s reputation as an area of high earthquake risk, it earns a lower hazard rank, 54, than San Jose 100 kilometers to the south, where the hazard rank is a whopping 88 (for further comparison, Manhattan earns a 6 and Chicago a 1). San Jose’s substantially higher rank arises because the San Andreas and Hayward faults sit on either side of San Jose, and because the city sits in a deep sedimentary basin that amplifies shaking. (Within a city itself, an individual location will also receive a rank; the app works at much finer scale than just citywide.) An even more surprising comparison is Ridgely, Tenn., near the epicenter of the 1811–1812 New Madrid earthquakes. Sitting on the banks of the Mississippi River in the middle of the country, Ridgely has a hazard rank of 60.
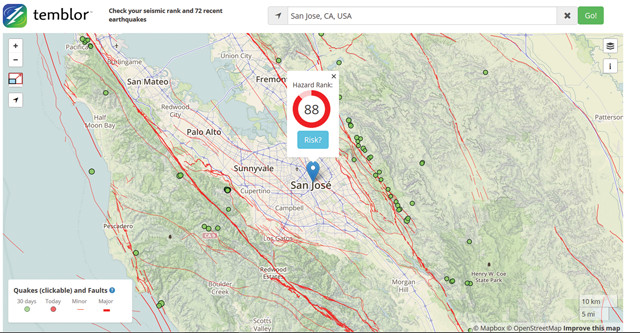
San Jose earns a high "Hazard Rank" in Temblor mainly because it is bounded by two major faults — the San Andreas to the west and the Hayward to the east — and because the city sits in a deep sedimentary basin that amplifies shaking and is highly susceptible to liquefaction. Credit: Temblor.net.
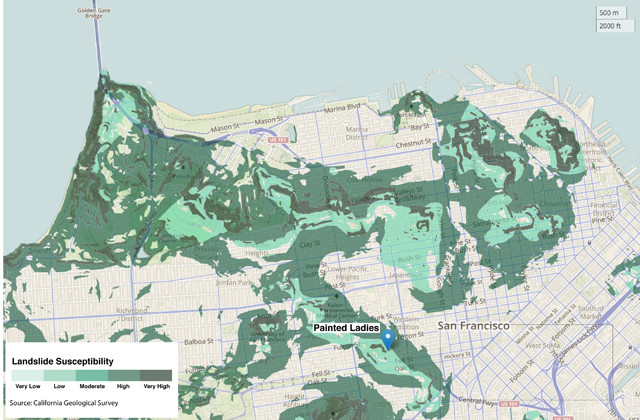
The Temblor app allows users to view an area's susceptibility to landslides Credit: Temblor.net.
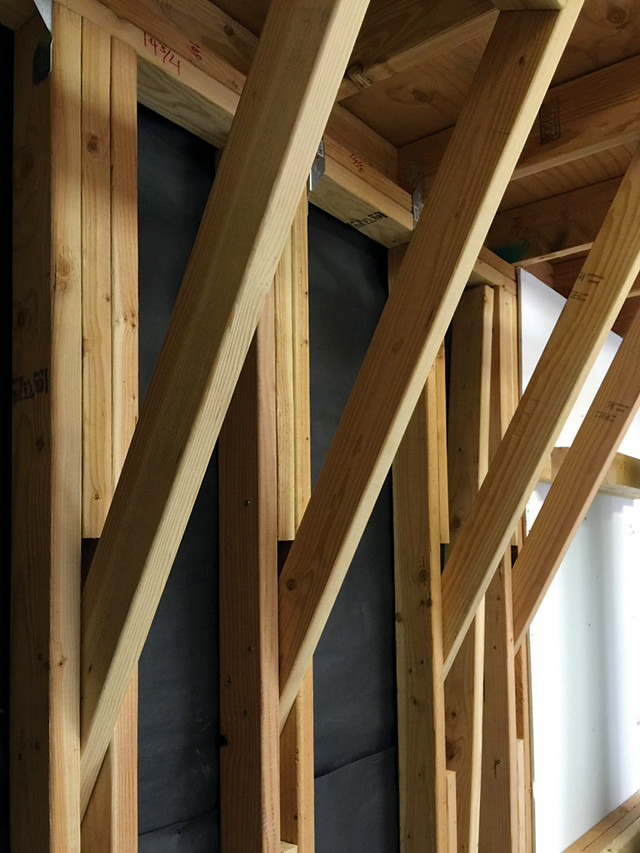
Retrofitting a house — for example, by bolting it to a concrete foundation, adding bracing frames to walls to reduce the effects of lateral shearing, and anchoring the roof to the walls — is one of the few ways homeowners can directly reduce their vulnerability to earthquake shaking. Credit: Ross Stein.
Aidan L., owner of a retrofit contracting company in San Francisco, is at a prospective client’s house, showing him where to bolt down the foundation and how to add shear walls to the garage to improve stability.
The client is skeptical. “How much?” he asks.
“About $10,000,” Aidan replies.
The client, leaning on his Porsche, replies, “Ridiculous!”
The client is no fool; but Aidan simply has no clear and credible way to demonstrate its value. Many people who have always lived in earthquake country don’t act to protect themselves because they believe that if the Big One strikes, they’re helpless no matter what — or they think the government, or their regular homeowner’s insurance, will bail them out. They are wrong.
Although most new construction is required to meet current seismic standards, before 1976, building codes in California insufficiently protected homes from strong shaking. Other states with seismically vulnerable areas, like Oregon and Washington, didn’t implement seismic codes until much later. Upgrading older homes usually involves bolting them to the concrete foundation, adding bracing frames to walls to reduce the effects of lateral shearing, and sometimes anchoring the roof to the walls.
Unfortunately, the seismic retrofit market is highly decentralized, with most jobs performed by small contracting firms. As a result, no one knows the number of homes in need of a seismic retrofit. The number could well be staggeringly high: Temblor estimates that fewer than 1 percent of California homeowners per year have retrofitted their homes since better seismic safety standards took effect in 1976, and that no more than one-third of California homes built before 1970 have been retrofitted.
Comprehensive cost-benefit analyses of seismic retrofitting are rare, but there are case studies that demonstrate the value of retrofit, especially for fragile, unreinforced masonry structures. Take, for example, the magnitude-6.5 earthquake that struck Central California in 2003. Of the 53 unreinforced masonry buildings in Paso Robles, all nine that were retrofitted escaped major damage. Many others were destroyed or damaged beyond repair. One building owner told the Los Angeles Times, “I’m confident the building would have come down in the quake if we hadn’t done the retrofitting. There were times when we were bleeding so badly in paying for it, we wondered what in the heck we were doing. Now we know.”
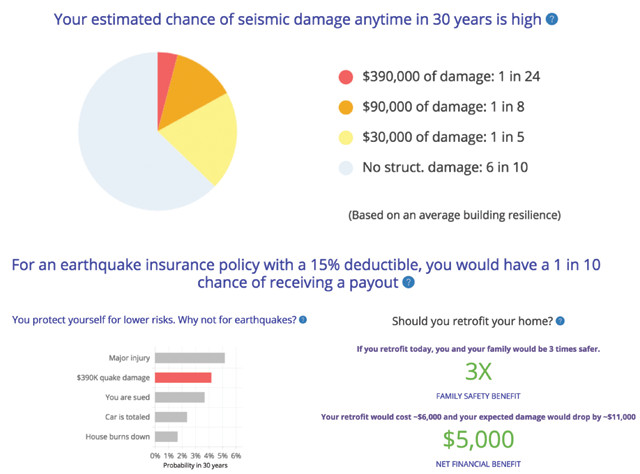
Based on the location and specifications of a particular home, Temblor offers an overview of the likelihood that that home will incur damage due to earthquake shaking, an estimate of whether earthquake insurance is a smart option, and a cost-benefit analysis of retrofitting a home. Credit: Temblor.net.
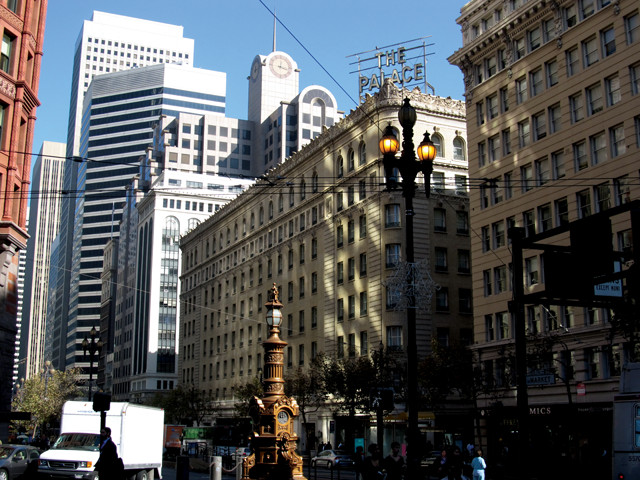
The landmark Palace Hotel in San Francisco — which was rebuilt in 1909 after being destroyed during the 1906 San Francisco earthquake and fire — was closed from January 1989 to April 1991 for restoration, during which time it was seismically retrofitted. Despite building standards that call for new construction to be seismically resilient, many buildings and homes in the city have not been retrofitted. Credit: Ken Lund, CC BY-SA 2.0.
Temblor seeks to inform people about the potential benefits of retrofitting without relying on an earthquake to do the talking. Temblor estimates the cost of a retrofit from the price and size of a home, as well as the financial benefit (or lack thereof) of retrofitting from hazard and building-fragility curves (see sidebar). The output is a free cost-benefit analysis for seismic retrofitting.
Retrofitting is an important element in seismic resilience because it is one of the few ways for homeowners to directly reduce their vulnerability. But people who live in liquefaction or landslide zones may find that retrofitting is either prohibitively expensive or cannot offer enough protection, and homeowners who don’t intend to live in their current residence for more than a few years might find a $6,000 retrofit too great an expense. In these cases, earthquake insurance may be the most prudent option.
Earthquake insurance can potentially provide large payouts in the event of heavy damage, but homeowners, and even insurance agents, often ignore it. Roughly 8 to 10 percent of California homeowners have earthquake insurance, and that percentage is even lower in other states with appreciable seismic risk like Oregon and Washington.
Insurance agents have a difficult time selling earthquake insurance because it is expensive — about twice the cost of fire insurance with four times the deductible — and not mandatory in the U.S. Furthermore, agents lack tools to educate people about the costs and benefits of insurance, and they often pass on fundamental misunderstandings to clients.
eri S., a realtor in San Carlos, Calif., recently told Stein that about one in five homebuyers ask her about earthquake insurance. Asked how she responds to those inquiries, Teri said, “I tell them that I’ve lived here for 30 years and I don’t have earthquake insurance.” This usually ends the conversation. But Teri might be doing her clients a disservice. Prospective homeowners should be informed about the vulnerability of a location to earthquake damage and the potential for being compensated for losses through insurance.
In Temblor, people can check to see if buying earthquake insurance is a smart option. Using seismic hazard and building data, Temblor quickly estimates a user’s chance of experiencing a small, medium or large amount of damage, as well as their likelihood of receiving an insurance payout.
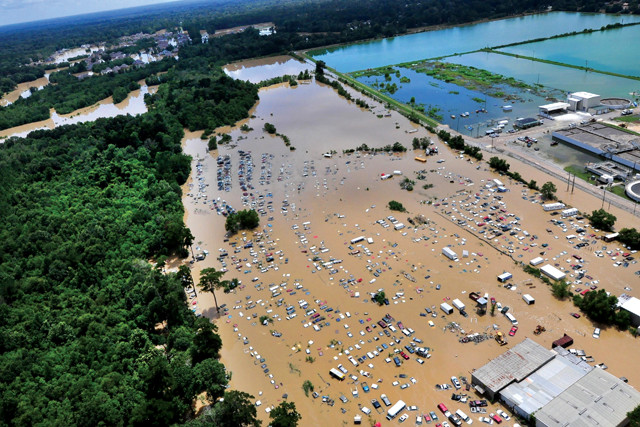
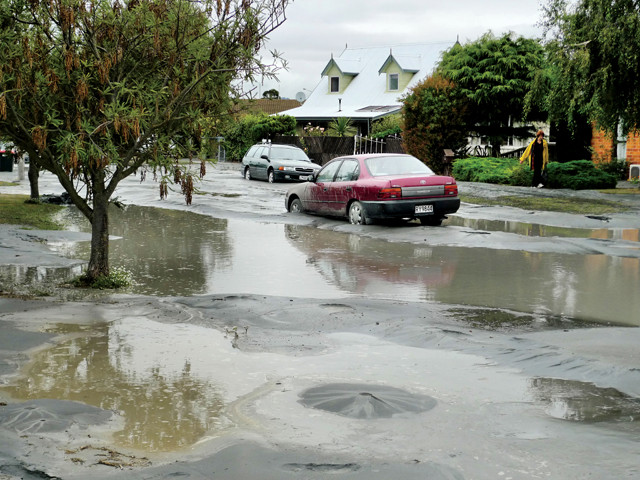
Temblor aims to communicate with a broad audience about natural hazards in part through its blog, which covers topics ranging from earthquakes of international importance, like the Italy earthquakes last fall, to small earthquake swarms in the U.S., to general seismic hazards such as liquefaction, and even flood events (seen here) like that in Louisiana last August. Credit: Coast Guard photo by Petty Officer 1st Class Melissa Leake.
Temblor also compares the risk of experiencing significant earthquake damage to that of other risks from which we often protect ourselves. For many people, homeowner’s, health and car insurance are facts of life. Most people have no way to compare the risks covered by these insurance policies to one another, let alone to the risks covered by earthquake insurance, yet they purchase such policies anyway. Temblor compares the likelihood of having a major injury, getting sued, totaling a car, and losing a house in a fire to the odds of sustaining major earthquake damage. In most seismically active parts of the country, quake damage is more likely than most other such misfortunes, so earthquake insurance should be considered among the options.
Beyond being a resource for property owners and real estate agents, Temblor sees its work as an opportunity to communicate with a wider audience about earthquakes. Temblor’s blog provides scientific insights for both experts and enthusiasts written by scientists with experience in earth sciences, engineering and insurance.
Temblor blog posts highlight a wide array of topics reflecting the interests of both the writers and the public. Coverage in features ranges from large, deadly earthquakes of international importance, like the Italy earthquakes last fall, to small earthquake swarms within the United States, to general seismic hazards, such as liquefaction and the San Andreas Fault, and even flood events like the flooding in Louisiana last August. Users can opt into alerts following large global earthquakes or find Temblor blog posts in Google News. The Temblor blog offers a way to rapidly publish insights and analysis in the earth sciences, and welcomes articles from outside contributors.
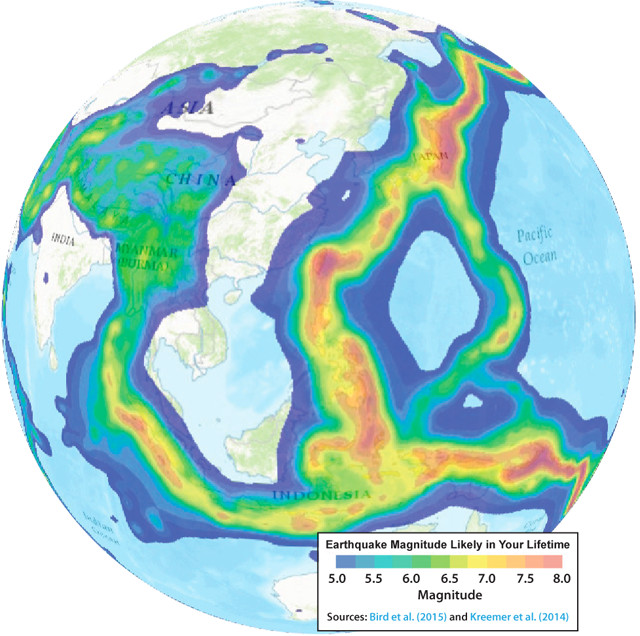
Temblor is expanding its coverage to the rest of the world. As of now, the best information that's available about countries other than the U.S. is a view of the maximum earthquake that is expected to affect an area in a person's lifetime, as shown through the Global Earth Activity Rate model. Credit: Temblor.net.
Many homeowners around the country will discover in Temblor that they face little seismic risk. But other hazards, notably floods, can occur almost anywhere. Temblor recently added FEMA’s U.S. flood hazard maps to the app. Users can now learn their flood and seismic risk in the same app.
In addition, although Temblor only has seismic hazard ranks for the continental U.S., earthquake hazard coverage should soon be expanding internationally. Currently, users anywhere on Earth can see the largest quake magnitude that they are likely to experience in their lifetimes, thanks to the Global Earthquake Activity Rate model. This model gives the likelihood of magnitude-6 to -9 earthquakes occurring in a given location by blending data on magnitude-6-plus earthquakes from the past 38 years with current strain rates derived from ground movement tracked by GPS. This provides a quick and easy way to check if a large global earthquake was surprising or run-of-the-mill. Just clicking on a location in the app will tell a user what the largest quake they are expected to experience might be.
Ultimately, Stein says, homeowners speak in the language of dollars and safety. Temblor must be able to speak to people in their own language, he says, “so that awareness is transformed into actions that reduce risk and increase resilience.”
© 2008-2021. All rights reserved. Any copying, redistribution or retransmission of any of the contents of this service without the expressed written permission of the American Geosciences Institute is expressly prohibited. Click here for all copyright requests.