
by Timothy Oleson Friday, May 20, 2016
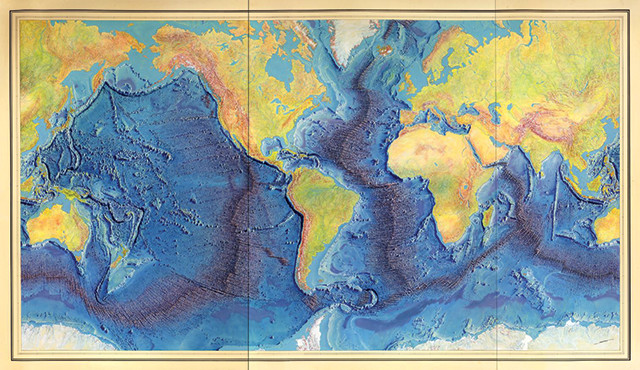
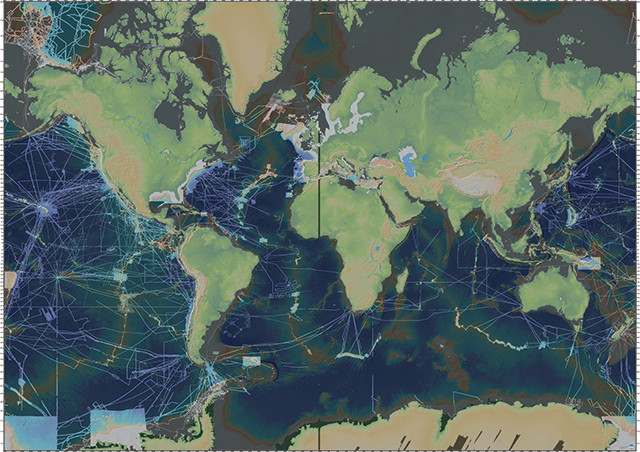
In the 1950s, Marie Tharp and Bruce Heezen, of what was then called the Lamont Geological Observatory, began creating seafloor maps based on single-beam sounding data from the U.S. Navy and other sources. Their compilation map of the global seafloor was published in 1977. Credit: Library of Congress, Geography and Map Division.
Gliding through pitch-black waters 50 meters off the ocean bottom, the “D. Allan B” can sense the seafloor below in striking clarity, despite the darkness. In its backyard off the California coast, the 5-meter-long, torpedo-shaped autonomous underwater vehicle (AUV) operated by the Monterey Bay Aquarium Research Institute (MBARI) has surveyed submarine topography ranging from deep canyons incising the continental shelf to subtle scarps weaving through blankets of ocean-bottom sediments. Since entering operation about a decade ago, the AUV’s mapping prowess — it can distinguish features less than a meter wide and just 10 centimeters tall, a level of precision that rivals NASA’s Mars-mapping HiRISE camera — has become an integral tool in MBARI’s efforts to study Earth’s surface beneath the waves.
In the California Borderland region just off the state’s southern coast, for example, detailed bathymetry has helped researchers piece together a clearer picture of the complex array of faults that parallel the shoreline. These offshore faults were formed by the same tectonic forces that created well-known faults on land like the San Andreas and San Jacinto, but a reliable view of the positions and sizes of the offshore faults — let alone their past movements or the potential hazards they pose — has eluded scientists. Yet, these Borderland faults — the Palos Verdes and San Diego Trough faults to name a couple — are thought to accommodate as much as 15 to 20 percent of the motion between the Pacific and North American plates.
“That’s not insignificant, particularly in Southern California where you’re dealing with potentially very large faults that are closer to the urban centers than the San Andreas is,” says MBARI marine geologist Charles Paull. “Some of the big faults are right offshore.”
Much remains to be learned about the tectonics off California, but high-resolution, AUV-acquired maps of the seafloor have allowed Paull and his colleagues to locate fault traces with far greater accuracy and even determine slip rates and past seismicity on some, information that should improve hazard assessments for the state.
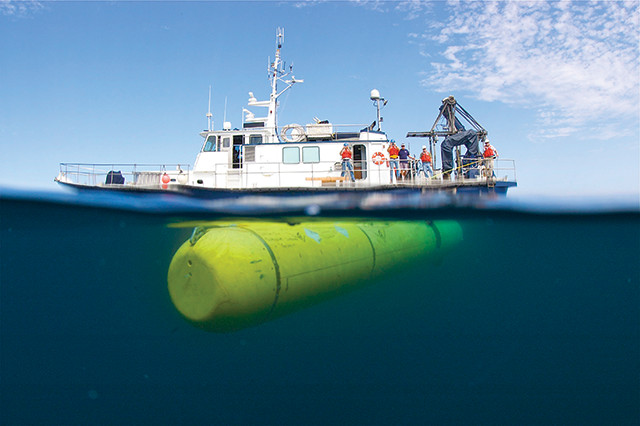
The Monterey Bay Aquarium Research Institute's torpedo-shaped autonomous underwater vehicle, the D. Allan B (foreground), is used to map portions of the seafloor with a spatial resolution of about 1 meter. Credit: Phil Sammet, ©2010 Monterey Bay Aquarium Research Institute.
Mapping is fundamental to understanding a place and the physical processes that shape it, and modern efforts to chart the seafloor date back to the birth of echo sounding in the early 20th century. But given the relatively recent advent of submersible mapping technology — along with ever-present limitations of scale, time and expense — only a tiny fraction has been surveyed so far at meter-scale resolution. “Rounding off,” Paull estimates, “it’s about zero percent.”
Even at spatial resolutions of 25 to 100 meters, somewhere in the neighborhood of just 10 percent of the seafloor globally has been mapped using modern bathymetric data collected by surface ships. That means that vast expanses of the ocean floor, which covers roughly 70 percent of the planet, remain virtually uncharted.
The many uses of seafloor mapping for economic and strategic applications, however, as well as in engineering, salvage and conservation operations, offer plenty of reasons to keep pushing the boundaries. In marine science, meanwhile, researchers say that detailed mapping could be transformative, helping geologists, biologists and others document and assess changes, large and small, due to underwater volcanism, earthquakes, landslides, hydrothermal activity and other natural phenomena.
Look at a topographic map of the world and, as on land, you’ll see long mountain ranges, expansive plains and enough bumps, ridges and other textures under the oceans to convince yourself that we’ve already mapped the seafloor in full. But in the same way that such a map won’t tell you a whole lot about the peaks and valleys in your hometown, global maps of the ocean basins don’t offer much local detail. In most terrestrial locations, we can zoom in to see finer details, but the nearly 1.4 billion cubic kilometers of seawater on Earth make things trickier in the oceans.
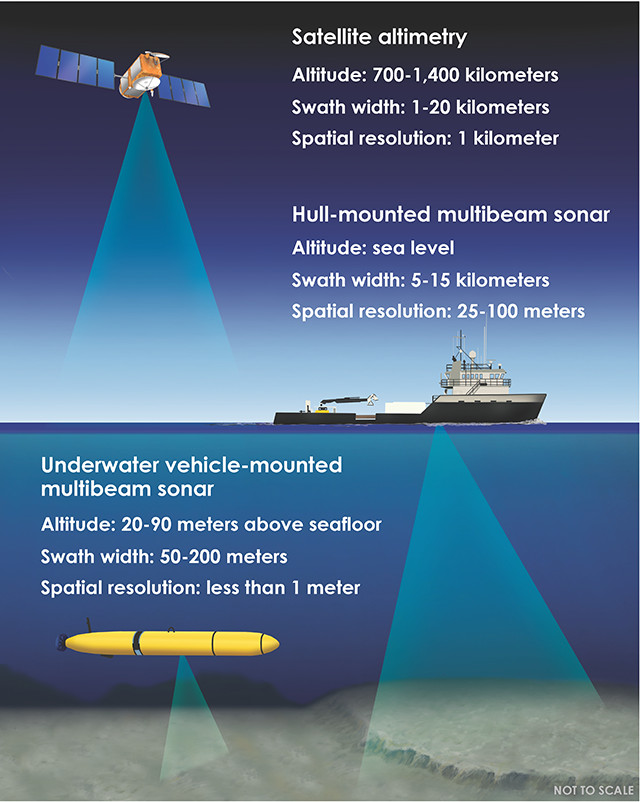
Three modern tools for collecting bathymetric data: satellite altimetry, hull-mounted multibeam sonar and underwater vehicle-mounted multibeam sonar. Satellite altimetry senses differences in the height of the ocean surface, which is subtly shaped by seafloor topography, as opposed to detecting bathymetry directly. All specifications are approximate. Diagram is not to scale. Credit: K. Cantner, AGI.
Advancements in seafloor mapping have been paced by the development of technology that has allowed us to see through the water with increasing coverage and resolution. Starting in the early 20th century, manual hydrographic surveying techniques like lead-lining and wire drags gave way to echo sounding, which converted the travel times of soundwaves emitted from and reflected back to ships into ocean depths.
By mid-century, echo-sounding technology matured into precision depth recorders employed by navies during World War II — when it took on the name sonar, short for “sound navigation and ranging” — and subsequently aboard civilian research vessels. In the 1950s, Marie Tharp and Bruce Heezen of Columbia University’s Lamont Geological Observatory (now Lamont-Doherty Earth Observatory, or LDEO) famously began compiling and plotting sounding data from the U.S. Navy and other sources to produce what would become the first modern picture of the global seafloor. Among other features, Tharp and Heezen’s maps documented not only the mid-ocean ridges but the rift valleys that bisected them — key evidence supporting the then-emerging theory of plate tectonics.
The soundings on which these maps were based came from single-beam sonar instruments, which collected and averaged depth information from individual spots on the seafloor. Thus, even in places well sampled by sonar, resolution was limited and educated guesswork was required to fill gaps in coverage.
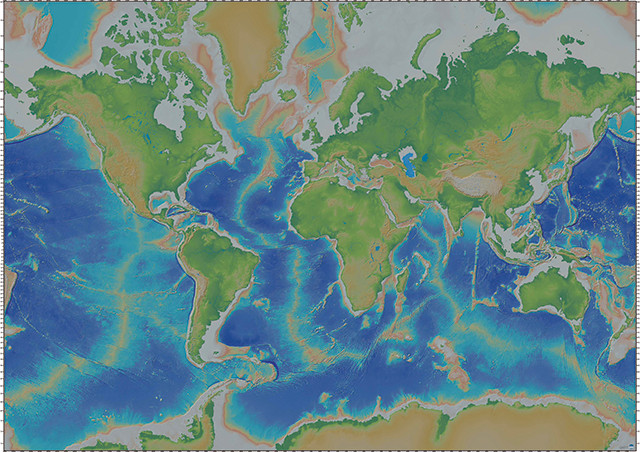
The modern map of the global seafloor is largely based on bathymetry derived from satellite altimetry. A relatively small proportion of the seafloor has been mapped at higher resolution using multibeam sonar, however. Credit: image from the Global Multi-Resolution Topography Synthesis, hosted by the IEDA Marine Geoscience Data System.
Publicly available multibeam data included in the Global Multi-Resolution Topography Synthesis covers only about 8 percent of the seafloor, (unshaded areas), although coverage is higher over continental margins and plate boundaries. Credit: image from the Global Multi-Resolution Topography Synthesis, hosted by the IEDA Marine Geoscience Data System.
The two main technologies still used today for large-scale seafloor mapping — satellite altimetry and multibeam sonar — were developed in the 1970s. Both offered immense improvements over single-beam sonar because they collect data over broad areas rather than distinct spots, minimizing the need for interpolation. It’s largely thanks to satellite altimetry over the ocean surface, which is subtly shaped by the topography below, that we have the seafloor maps we’re accustomed to seeing in textbooks.
David Sandwell of the Scripps Institution of Oceanography and Walter Smith of NOAA’s Laboratory for Satellite Altimetry pioneered a comprehensive, satellite altimetry-based map of the global ocean seafloor starting in the 1990s. And such measurements, with resolutions down to about 1 kilometer, continue to reveal previously unseen underwater features such as buried seamounts and extinct rift zones.
Sandwell and Smith’s map “is fabulous and dramatic, and it gives us this holistic perspective on a global scale,” says Daniel Fornari, a marine geologist at Woods Hole Oceanographic Institution (WHOI). “But, in terms of really getting down to the details and processes” occurring at the bottom of the ocean, Fornari says, “we need to map it in great detail.” For the last 35 years or so, this has largely meant relying on multibeam sonar.
Multibeam sonar became available to civilian researchers in the 1980s and progressed from arrays using just a dozen sensors to modern systems that fan out hundreds of acoustic signals beneath a ship, continuously scanning swaths of the ocean bottom. The clarity and coverage of multibeam bathymetry vary depending on the frequency of the soundwaves, as well as on water depth. Low-frequency waves travel farther through seawater without dissipating, but offer lower resolution. Meanwhile, the deeper the water, the wider the sonar signal can fan out for more coverage, but the blurrier the resulting image of the seafloor.
“With ship-based sonars, we can resolve seabed topography with a spatial footprint of 50 to 100 meters in the deep ocean, and with much smaller footprints [down to a few meters or so with specialized shallow-water sonars] on the continental shelves,” says Suzanne Carbotte, a geophysicist at LDEO.
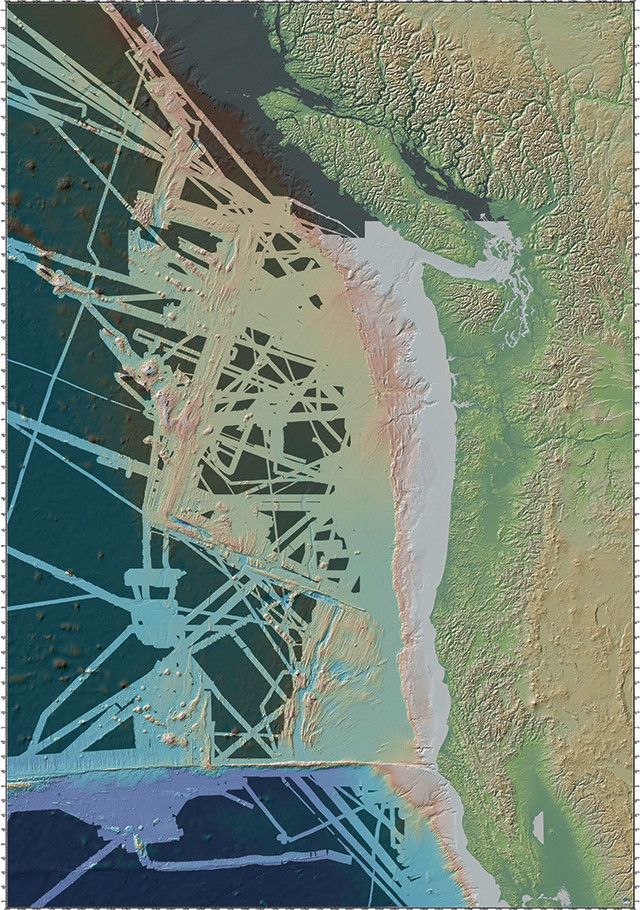
Shaded areas in this map, in the vicinity of the Juan de Fuca Plate off the northwest U.S. coast, represent portions of the seafloor for which shipboard multibeam bathymetric data are unavailable in the Global Multi-Resolution Topography Synthesis. Credit: image from the Global Multi-Resolution Topography Synthesis, hosted by the IEDA Marine Geoscience Data System.
With multibeam in use for several decades it might seem that most of the seafloor should have been covered by now, at least once. However, “we’re very much limited by the immensity of the ocean and the expense of acquiring these data,” Carbotte says, as well as by the limited number of research vessels equipped to collect multibeam bathymetry. There’s also the fact that mapping is usually not the guiding priority on oceanographic cruises, and that “scientists tend to go back to the same regions … to follow up on insights that we’ve gained from previous work,” she says. All told, the total portion of the seafloor that has been mapped in high resolution — and for which data are publicly available — remains small, probably about 10 to 12 percent. Additional data held by the U.S. and other governments, as well as by private companies, are often not shared because the data are considered proprietary or strategically sensitive.
Multibeam data from research cruises and other sources that are made public, however, are added to repositories for processing, storage and assimilation into high-resolution maps. Internationally, the GEBCO (GEneral Bathymetric Chart of the Oceans) collaboration has long collected voluntarily contributed datasets. And in the U.S., NOAA’s National Centers for Environmental Information serves as the national archive for raw mapping data; LDEO, meanwhile, helps transfer raw data from ships to the NOAA archive, and also processes the archived data into forms that can be easily used by others.
LDEO has “spearheaded the effort to process the high-resolution data,” Carbotte says, producing and continually updating a publicly accessible bathymetry synthesis for the global ocean that has been incorporated into geographic information systems software as well as Google Earth. The latest version of its Global Multi-Resolution Topography Synthesis, released last November, contains high-resolution multibeam data from 875 separate cruises totaling nearly 4.5 million kilometers in track length. The synthesis covers roughly 8 percent of the global seafloor.
“The research community, in terms of mapping, has really focused on the plate boundary regions and the continental margins where people live and are more affected by [seafloor] processes,” Carbotte says. Thus, coverage with multibeam bathymetry is substantially higher “where most of the action is happening on the seabed,” although the maps aren’t complete even in these places.
arbotte and her colleagues have been looking in recent years at the Cascadia Megathrust off the U.S. Pacific Northwest coast, for example, where the Juan de Fuca Plate subducts under the North American Plate. Scientists suspect the fault is capable of producing earthquakes comparable to the magnitude-9 Tohoku quake that struck off Japan in 2011. “We’re studying aspects of the downgoing plate that contribute to the subduction process,” she says, work that links sonar observations of seafloor morphology with seismic data of the subsurface to better understand how the megathrust might behave.
The main portion of the Juan de Fuca Plate has been mapped with data from different cruises over the years, but “not in a systematic way … there are a lot of holes in the coverage and artifacts associated with variations in data quality,” Carbotte says. “So, even though it’s in our backyard, and the processes that are happening offshore are potentially very impactful for people living on the West Coast, we don’t have a complete image of the plate.”
The sharper resolution of shipboard multibeam bathymetry compared to altimetry-based bathymetry (blurry areas at left mostly) can be seen in this map of seamounts near the Juan de Fuca Ridge. Credit: image from the Global Multi-Resolution Topography Synthesis, hosted by the IEDA Marine Geoscience Data System.
Having consistent high-resolution maps over subduction zones, ridges, seamounts and other features is also important for documenting large-scale change brought about by submarine earthquakes and volcanism, Carbotte says. In the case of the Tohoku quake, which ruptured along the subduction zone beneath the Japan Trench, she notes that researchers had “beautiful before and after bathymetry surveys” of the seabed in the area. The surveys showed that the landward seafloor near the trench lurched 50 meters horizontally and 10 meters vertically, substantial shifts that contributed to the massive tsunami that swept over the Japanese coastline.
nfortunately, data collected at the sea surface by sonar will only get us so far. So, scientists have begun taking the technology beneath the waves aboard deep-diving underwater craft.
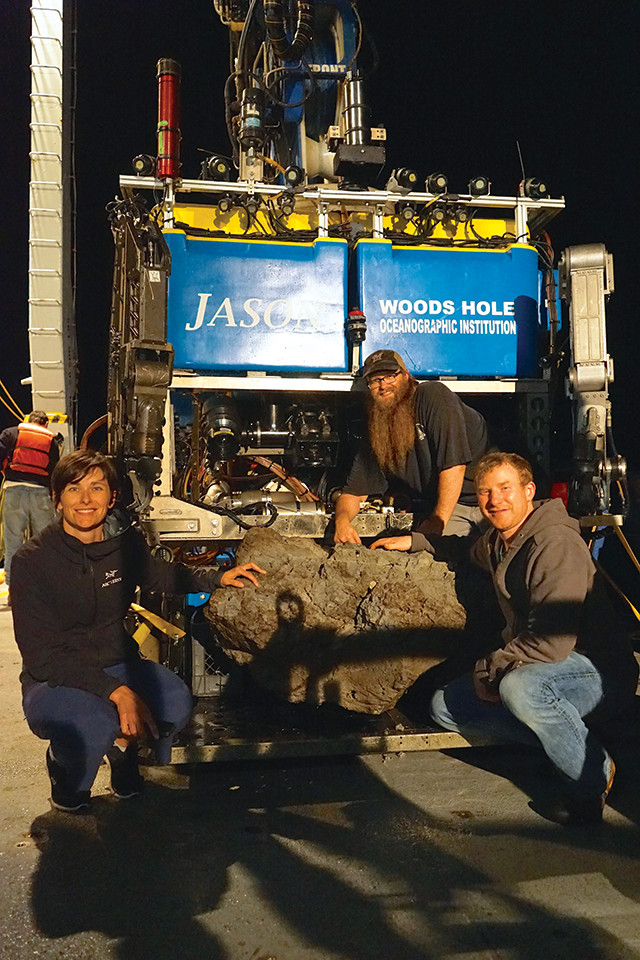
In 2015, researchers sailed to Havre Seamount with Sentry, an autonomous underwater vehicle, and Jason (background), a remotely operated underwater vehicle, to map the fallout of an eruption in even more detail than could be seen from shipboard bathymetry. Here, Rebecca Carey (left) of the University of Tasmania in Australia and Korey Verhein (center) and Adam Soule of Woods Hole Oceanographic Institution pose with a large pumice block recovered from the seamount using Jason. Credit: courtesy of Adam Soule, ©Woods Hole Oceanographic Institution.
For researchers studying past and present volcanism on land, the extent, volume and flow morphologies of lava erupted tend to be among the first pieces of information assembled — typically through aerial, satellite or field mapping. Until recently, similar capabilities have simply not been available for studying submarine volcanism. But now, current near-bottom multibeam mapping is on par with what can be done on land, Fornari says, thanks to the deployment of remotely operated vehicles (ROVs) tethered to support ships starting in the late 1980s, followed a decade later by untethered AUVs. And in the last 15 years in particular, improvements in “near-bottom” instrumentation have provided opportunities to study the seafloor in unprecedented clarity.
“What we have available to us nowadays, through ROV or AUV mapping, is basically the equivalent of a digital elevation model with sub-meter resolution, both spatial and vertical,” Fornari says. The combination of these mapping capabilities with sidescan and Compressed High-Intensity Radiated Pulse (CHIRP) sonar — which image seafloor and sub-seafloor textures, respectively, rather than bathymetry — as well as chemical and geophysical observations made simultaneously (or following initial reconnaissance mapping), makes for a powerful tool for studying features on the seafloor. “When you’re getting higher resolution, you’re able to make some very strong inferences on what’s causing the feature,” or how it’s related to other processes that are going on, Fornari says.
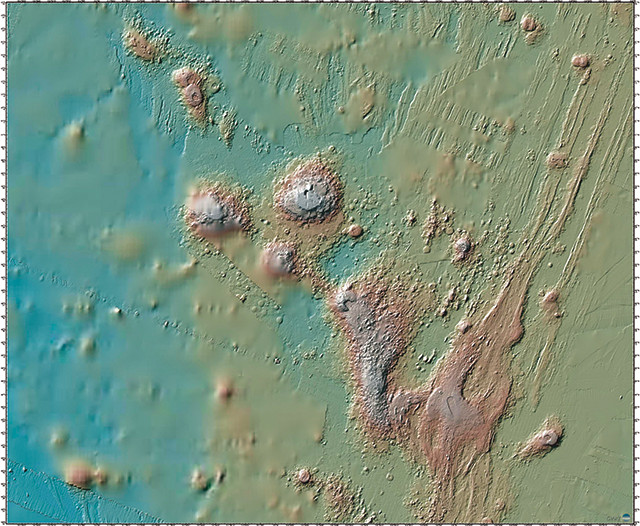
In July 2012, an explosive underwater volcanic eruption sent a vast raft of pumice floating to the ocean surface north of New Zealand. The exact source of the pumice was a mystery until analysis of satellite imagery and a subsequent shipboard multibeam survey by researchers from New Zealand identified the Havre Seamount in the Kermadec Island Arc as the site of the eruption. Compared to an earlier survey, the updated bathymetry showed fresh volcanic cones that had formed and a new bulge in the caldera wall.
But, while useful for confirming the eruption site, there wasn’t much detail to be seen in the imagery, says Adam Soule, a volcanologist and chief scientist for deep submergence at the National Deep Submergence Facility housed at WHOI. The new features basically showed up as “a new lump there and a new lump here.” So, in April 2015, Soule, Fornari and colleagues sailed to Havre equipped with Sentry and Jason — an AUV and ROV, respectively — to take a closer look. “The map that was produced [to be released in a forthcoming publication] was absolutely gorgeous; one of the most beautiful that Sentry has made,” Soule says.
From the bathymetric data, Soule says, “we could see lava flows that had cascaded down the caldera wall and onto the caldera floor.” The researchers also noticed large bumps dotting the seafloor, which, when they then sent video-equipped Jason down to investigate, turned out to be pumice blocks 1 to 5 meters in diameter — the “biggest pumices I had ever seen, scattered all over,” Soule says. Elsewhere, the seafloor was smooth from where landslides had “pushed all these giant pumices downhill.” The information was “valuable because we got a nice cross section of the pyroclastic deposits that were produced,” he says.
“If we hadn’t had Sentry and we hadn’t had the ROVs, there’s no way that we would have been able to understand” what happened at Havre as well, Fornari says.
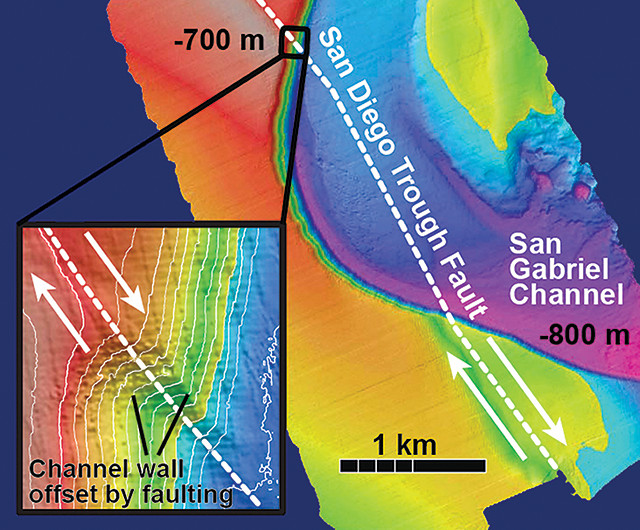
A 2012 study that made use of the seafloor mapping and sampling capabilities of underwater vehicles revealed that the San Diego Trough Fault Zone has slipped about 1.5 millimeters per year on average over the last 12,700 years and that the fault zone extends 60 kilometers farther north than previously thought. Credit: ©2016 Monterey Bay Aquarium Research Institute.
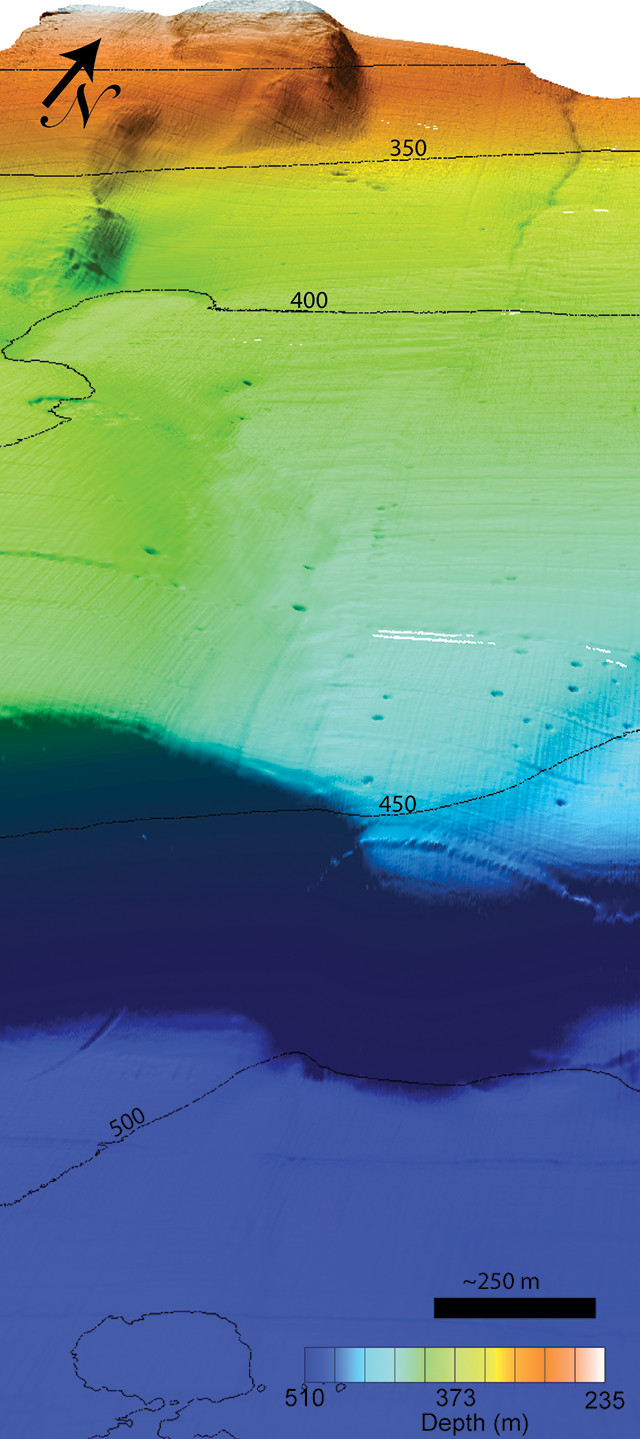
This perspective view of the seafloor near the Palos Verdes Fault about 25 kilometers off Newport Beach, Calif., is based on high-resolution bathymetry collected by the Monterey Bay Aquarium Research Institute's mapping AUV, the D. Allan B. The fault trace can be seen running from top right toward bottom center in the image (vertical exaggeration is 5x). Credit: ©2016 Monterey Bay Aquarium Research Institute.
A similar technological transition has been occurring in studies of seafloor faults. Researchers have a number of tools and techniques available to assess the position and past displacements along near-surface terrestrial faults, from lidar and InSAR to sampling rocks across and along fault strikes. While current fault maps for California do indicate offshore faults, in many instances the faults’ exact locations and whether or not they’ve been active on historic or Holocene timescales — factors that affect their perceived future hazard — are unclear because of the difficulty seeing them up close.
Most of these faults have been mapped because researchers looking at seismic profiles observed fault-like structures at depth below the seafloor, Paull says. But even if a fault is present, it might not have been active for thousands of years or more, he says. “We are just now developing the technologies … to allow the type of detailed studies that you need in order to constrain recent movements of [submarine] faults.”
In recent years, Paull and his colleagues have used MBARI’s underwater vehicles to take close looks at some prominent known faults off Southern California. High-resolution bathymetry has given them pictures of seafloor topography — including both large fault offsets and scarps just centimeters high — that are sometimes even clearer than what can be achieved on land, where ground cover and erosion can obscure such features, Paull says. Mapping can be followed up with targeted ROV deployments to “surgically sample” across a fault by collecting sediment samples and geophysical profiles. That helps researchers know where a fault is and where the last ruptures were, he says, and get data about the timing of these events.
In a 2012 study, these efforts revealed that the San Diego Trough Fault Zone (SDTFZ), about 60 kilometers off the coast, has slipped about 1.5 millimeters per year on average over the last 12,700 years or so — the first such rate determined for a fault entirely offshore in the California Borderland. Additionally, the study showed that the SDTFZ extends 60 kilometers farther north than previously thought by way of a “stepover” region where the fault jogs subtly to the west. The location of the stepover, the researchers noted, coincides with the aftershock swarm associated with the 1986 Oceanside earthquake — a magnitude-5.4 temblor responsible for at least one death and 29 injuries — suggesting this region could have been the source.
Meanwhile, the roughly 100-kilometer-long Palos Verdes Fault (PVF), which traverses from offshore onto land near Long Beach and then back offshore again near Torrance, is thought to be capable of producing earthquakes up to magnitude 7.3. Although the PVF has not unleashed any quakes in historic times, how it deforms and its prehistoric activity “are poorly constrained,” Paull and his colleagues wrote in a study published last year in the Journal of Geophysical Research – Solid Earth. In the study, they found that the PVF has likely been slipping 1.6 to 1.9 millimeters per year on average since the Late Pleistocene — less than previous estimates based on studies on land — and that it appears to have ruptured three times in about the last 10,000 years, perhaps most recently within the last several hundred years.
“Constraining the motions of big fault systems that are offshore of major metropolitan areas is a topic that clearly demands respect,” Paull says. These data can be incorporated into California’s fault map, and “ultimately play a role in building codes and earthquake insurance.”
In addition to volcanism and seismicity, high-resolution mapping is helping researchers study other seafloor processes, including natural gas seeps, hydrothermal vents and submarine canyons. “The stage is set, in the 21st century, to be able to make a lot of substantial contributions to our understanding of the ocean floor in many environments,” Fornari says.
At MBARI, Paull’s team has also been studying underwater canyons, like Monterey Canyon, which play major roles in transporting large volumes of sediments, nutrients and pollutants from the continents to the deep ocean.
“Submarine channels are probably only second to rivers in terms of moving materials across the surface of Earth,” Paull says. Yet, he adds, for all we know about rivers, “we know shockingly little” about how their marine counterparts operate. “The ability to make detailed maps and to access that environment has completely changed what we are studying in submarine canyons … from the crude shape of what a canyon looks like to how a canyon is changing” due to submarine landslides or other phenomena.
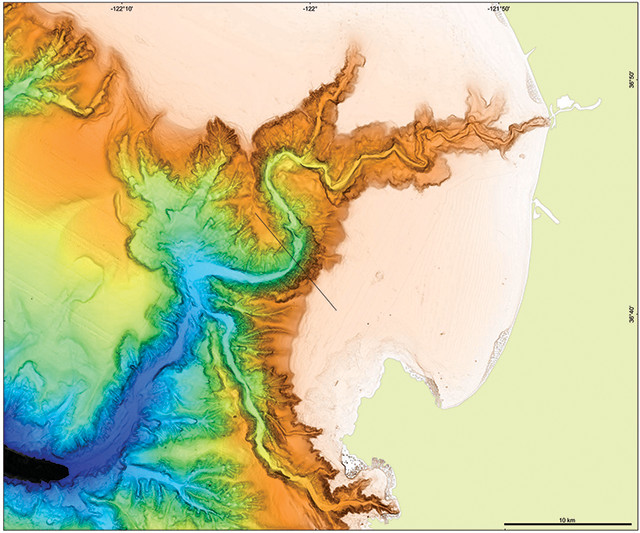
In addition to volcanism and seismicity, high-resolution mapping is helping researchers study other seafloor processes and environments, such as underwater landslides in Monterey Canyon off California. Credit: ©2012 Monterey Bay Aquarium Research Institute.
Mapping hydrothermal vents and other biological hot spots, such as marine reserves, should also help scientists assess how these areas evolve over time, which may assist authorities in protecting them, Soule says. There are economic, political and societal uses as well: mapping potentially mineral-rich areas, or the exclusive economic zones surrounding countries; or searching for downed ships, aircraft or other man-made debris, for example.
And then there’s the notion of continuing to map unexplored areas simply for the sake of broadening our submarine horizons. “There’s a whole universe in the ocean,” Fornari says, “it’s just harder for people to visualize” than Earth’s surface.
Yet, when people actually see what seafloor ecosystems look like, or they’re able to appreciate the huge scale of the topography — that there are underwater canyons larger than the Grand Canyon or how Mauna Kea, from base to summit, is actually taller than Mount Everest, for instance — it can affect them emotionally, Soule says. “As humans, we want to know what our environment is like,” he says. But there is “this vast part of our planet that we don’t know much about. Every time we reveal something, it is, I think, exciting and beneficial.”
How long it might be before there is a complete map of the seafloor that stacks up against, say, the maps we have of the surfaces of the moon or Mars, or indeed whether we’ll ever have such a map is anyone’s guess.
Even at the resolution of shipboard multibeam, Carbotte says the cost of fully mapping the seabed would require a financial commitment comparable to some big-ticket space missions, a scale not seen in oceanographic research budgets. With ongoing efforts, however, she says she’s “very optimistic that we’ll have comprehensive mapping of the coastal regions, and particularly the subduction zones that really impact people.”
Technical challenges for seafloor mapping efforts persist as well, including limited durations and ranges of mapping excursions. Another issue is the difficulty of navigating underwater vehicles while trying to make precise, repeatable centimeter-scale measurements, which impacts resolution as well as the ability to merge bathymetric datasets collected at different scales.
But innovation is a standing goal, researchers say, and continuing efforts to improve submersible sonar instrumentation, battery life, miniaturization, autonomy and navigation should lead to even better capabilities down the line.
In recent years, new players, such as Google, the Schmidt Ocean Institute and the XPRIZE Foundation, have also ventured into marine science and mapping, teaming with traditional research organizations to push the science and technology farther. Google has worked to make the seafloor more accessible to the public by incorporating high-resolution bathymetry collected by LDEO, NOAA and others into Google Earth, announcing the latest update early this year. Meanwhile, since 2009, Schmidt has supplemented the existing oceanographic fleet with its multibeam-equipped research vessel Falkor, offering researchers another platform from which to conduct mapping and research; it is also currently developing its own ROVs. And in December, XPRIZE announced a three-year, $7-million “global competition challenging teams to advance ocean technologies for rapid and unmanned ocean exploration.”
“There is plenty of room at the table for partners and solutions,” and “huge” benefits of the contributions of these organizations, Soule says. While XPRIZE is trying to catalyze development to overcome technological hurdles, he says, Schmidt and others are contributing to meet challenges on the resource end. “We’ve reached a point in our technological evolution where, with some effort and some resources, we can lay bare the ocean basins and really understand what’s down there,” Soule says. “It’s a pretty exciting time for mapping in the oceans.”
© 2008-2021. All rights reserved. Any copying, redistribution or retransmission of any of the contents of this service without the expressed written permission of the American Geosciences Institute is expressly prohibited. Click here for all copyright requests.