
by Sara E. Pratt Tuesday, September 2, 2014
Save the handful of Vikings who settled an ice-free stretch of Greenland’s southwest coast during the Medieval Warm Period a millennia ago, few humans have ever laid eyes on even a fraction of the land that lies below Greenland’s 1.7-million-square-kilometer ice sheet. Now, courtesy of a new model, scientists are seeing a detailed view of the topography underlying the ice sheet, which is an important control on the flow and discharge of ice into the ocean.
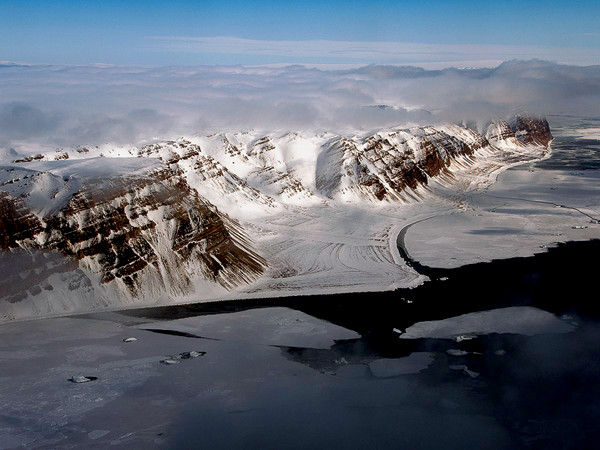
Flights over Greenland during NASA's Operation IceBridge missions use airborne ice-penetrating radar to image the surface below the ice. Credit: NASA/Michael Studinger.
“Our findings imply that the outlet glaciers of Greenland, and the ice sheet as a whole, are probably more vulnerable to ocean thermal forcing and peripheral thinning than inferred previously from existing numerical ice-sheet models,” the team, led by Mathieu Morlighem of the University of California at Irvine, wrote in Nature Geoscience.
Currently, the main method of imaging the land surface below the ice sheet is airborne ice-penetrating radar, which last year revealed a previously unknown 750-kilometer-long subglacial valley rivaling the Grand Canyon, and two subglacial lakes discovered under Greenland’s ice.
Airborne ice-penetrating radar, like that flown on aircraft during NASA’s Operation IceBridge missions, does well at imaging inland areas and broader valleys, but data can only be collected along aircraft flight lines. Also, in the many narrow valleys that fringe the ice sheet, radar bounces off canyon walls before it reflects off valley bottoms, leaving blanks in topographic data. Those data are needed for models of ice-sheet dynamics, flow and discharge into the ocean, all of which are critical for models of sea-level rise.
The new model combines snowfall and surface-melt data with high-resolution ice-velocity data from satellite interferometry to calculate the volume of ice moving through a given area. This allowed researchers to calculate ice thickness, which they then constrained with observed, but sparsely available, ice-thickness data gathered by ice-penetrating radar. Bed topography was then inferred by subtracting the calculated ice thickness from a digital elevation model of the ice surface, derived from satellite altimetry.
The new model aims to fill in the blanks by extending the topographic profile beneath the ice to the bottoms of narrow canyons, even in areas with complex geometry like the coast, Morlighem says. “The method that I have been using to map the bed topography of Greenland is surprisingly simple,” he says. “I use the principle of mass conservation: that is, what comes in comes out.”
The team found that many of the U-shaped, glacially carved valleys on the periphery of the ice sheet were deeper and that the valley bottoms remained below sea level farther inland than previously thought.
Seawater is not currently penetrating beneath the ice up these valleys, Morlighem says, but many glaciers in Greenland are accelerating and retreating, some due to interaction with warmer ocean currents. How marine-terminating glaciers will react — and contribute — to rising sea levels in the future is an open question.
Older models predicted that the glaciers would retreat a little bit inland and stabilize because they would not be in contact with the ocean anymore," Morlighem says. But if these valleys are below sea level for hundreds rather than tens of kilometers in some cases, as the new model suggests, it will take longer for them to reach a stable position above sea level.“The ice sheet is therefore more vulnerable than anticipated,” Morlighem says, “and existing projections of sea-level rise contribution from Greenland are too conservative.”
“They’re probably right that the airborne radar has not seen the extent of these ice-built fjords,” says Bob Bindschadler, an emeritus scientist at NASA who has studied ice-sheet dynamics for decades. However, he says, there are limits to the new technique; for example, “at some point there are details of the bed that won’t be expressed in the surface topography and the ice velocity.”
More work is needed to confirm the model, Bindschadler says. “Overall, [Morlighem and his team] made an important point and it deserves emphasis, but without a robust dynamic model looking at the ice-flow consequences of this, what this means for more ice coming out faster from Greenland remains unclear.”
Morlighem says he next plans to model how the new bed topography could affect projections of sea-level rise.
© 2008-2021. All rights reserved. Any copying, redistribution or retransmission of any of the contents of this service without the expressed written permission of the American Geosciences Institute is expressly prohibited. Click here for all copyright requests.