
by Irina Overeem Friday, March 14, 2014
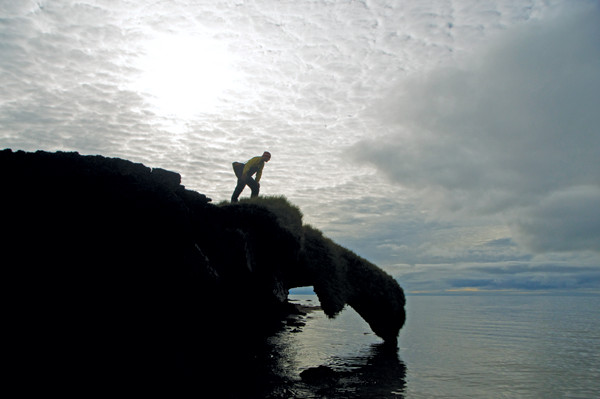
USGS scientist Frank Urban peers over the edge of an overhanging bluff. The grassy mat of surface vegetation often remains intact the longest and hangs off the edge of the undercut icy sediments. Credit: Adam LeWinter, Extreme Ice Survey.
In late summer 2008, the phone rang in my office at the Institute of Arctic and Alpine Research in Boulder, Colo. On the other end of the line was my colleague Frank Urban, a U.S. Geological Survey (USGS) climate scientist, who was calling, via satellite phone, from our research site in Alaska on the shore of the Arctic Ocean.
Earlier that summer, our team from the University of Colorado at Boulder — Bob Anderson, Cameron Wobus, Nora Matell and I — had camped at the site for four weeks while installing time-lapse cameras and other monitoring equipment to study erosion of permafrost on Alaska’s Arctic coast.
Urban had returned to our remote field sites in late August to do some maintenance on the meteorological stations and to retrieve our time-lapse cameras, which had been snapping pictures of the bluffs along the Beaufort Sea coastline every four hours throughout the summer.
Fortunately, he informed me, he had arrived just in time to save the cameras from falling into the sea, but he wasn’t able to save the sea-surface temperature loggers. A thousand-ton block of previously frozen earth had eroded from the overhanging bluff and toppled onto them.
The collapse that claimed our equipment was just one small example of the rapid coastal erosion occurring throughout the Alaskan Arctic.
In the last 30 years, the average air temperature over the North American Arctic has increased by 3 degrees Celsius, far exceeding the global average increase of 0.85 degrees Celsius between 1880 and 2012, that was just published by the Intergovernmental Panel on Climate Change. As a result, the perpetually frozen soil and subsurface — the permafrost — is warmer than when scientists from USGS began systematically probing its temperature in the early 1980s.
Warming manifests itself dramatically in changes to the sea ice that covers the Arctic Ocean. Every year, the Arctic Ocean freezes over during winter; only for a few months each summer does the thin lid of sea ice melt to expose the open ocean. In September 2007, the year before we first deployed our cameras, the Arctic sea-ice extent reached a historical minimum. This trend has continued; in August and September 2012, sea ice covered less of the Arctic Ocean than at any other time since satellite measurements began in 1979. Scientists at the National Snow and Ice Data Center in Boulder, Colo., reported that even during the relatively cool summer of 2013, the sea-ice minimum extent in September was low compared to the long-term average.
The sea-ice melt in turn has affected the land by increasing the impact of waves along the Alaskan coast. The longer the ocean is free of ice, the farther sea ice retreats from the coast. This increases the expanse of open water over which the wind blows, creating higher waves and storm surges, which increase coastal erosion. When the nearshore water level rises during a storm, it can undercut the bluff, which eventually breaks off, forming a large toppled block.
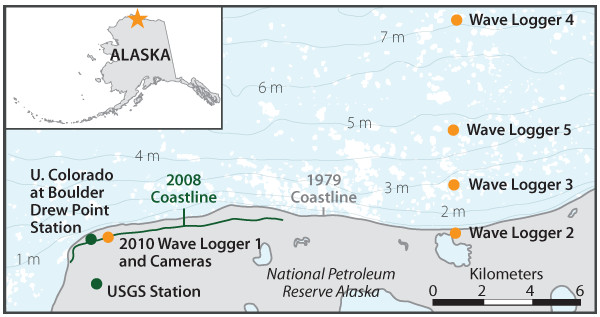
Overview of the Beaufort coast study area near Drew Point. The basemap shows the coastline in 1979 from a LANDSAT satellite image. The dark green line indicates the 2008 coastline. The locations of meteorological stations, wave sensors and water-level sensors are shown. Note that all the wave sensors were deployed in the ocean, but some appear to be onshore on the 1979 basemap because the coast in that area has since eroded. Credit: Kathleen Cantner, AGI, after Barnhart et al., Journal of Geophysical Research (2013).
Thus, the coast could be severely impacted by climate change in the Arctic. We hypothesized that the rate of coastal erosion could be predicted by measuring all parts of the coastal system, from properties of the permafrost to atmospheric conditions, water levels, wave heights and the temperature of the seawater.
We tested our hypothesis along the coast of Alaska’s North Slope, which stretches more than 3,000 kilometers along the Arctic Ocean. The North Slope is a vast stretch of tundra dotted with thousands of marshy thaw lakes. Viewed from the low-flying bushplanes that provide the main mode of transport in this region, the lakes glisten brightly in the sunlight. Slightly higher and drier areas have a giraffe-skin pattern formed by frost wedges that create interlocking polygons of ponds and pools. The coast at our study site forms the northern boundary of this landscape. At Drew Point, our team’s study site about 100 kilometers southeast of Point Barrow, the shoreline consists of steep bluffs, 3 to 5 meters high and composed of fine-grained, silty muds held together by ice. The tops of the bluffs are covered by thin grassy mats, which grow in the so-called “active layer” of the soil that thaws each summer.
As these coastal permafrost bluffs are undercut by waves, they break off in large chunks; they are currently retreating an astonishing 15 meters per year. That is more than double the rate of several decades ago. Based on the earliest topographic survey and the first satellite images, collected between 1955 and 1979, coastal retreat was about 7 meters per year. With accelerating erosion rates, about 27 square kilometers of land had been lost by 2007. Our team had heard that the rate of yearly bluff erosion was high before arriving at Drew Point. But in June and early July 2008, we had not yet seen the erosion in action.
By late June, the entire Arctic is bathed in sunlight all day and all night, and the exposed bluff faces begin to thaw slowly. Water and mud drool down the faces of the steep, icy bluffs. In 2008, we measured the thaw as just a few centimeters a day. At that rate, and with only a short Arctic summer, it did not add up to 15 meters per year. We needed more data to understand what was going on.
We installed a meteorological station to record winds, air temperature and permafrost soil temperature onshore. We tried to install oceanographic equipment offshore as well, but the sea ice remained solidly anchored to the seafloor and, if deployed, our sophisticated wave and temperature sensors would have rafted away, dragged along with chunks of ice.
So instead, to measure the ocean-surface temperature, we deployed several inexpensive temperature sensors tethered to the shore on long cables. We then installed the time-lapse cameras to keep track of erosion over the rest of the summer, close enough to the edge of the bluff to get a good view and far enough away so as not to lose them before Urban could revisit the site in August.
When Urban retrieved the time-lapse cameras, we were intrigued by what we saw. The images showed that the bluff erosion rate sped up dramatically once the remaining sea ice clinging to the shore disintegrated and the open ocean could lap onto the base of the coastal bluff.
We also discovered that the erosion was predominantly a thermally induced process; the seawater must be warm enough to thaw the ice that holds the permafrost together. First, the frozen bluffs are undercut by the relatively warm water. The undercut portion then breaks off and falls onto the narrow beach, where it disintegrates rapidly. Our cameras, which we had deployed inland from the coast, were hanging from one of these toppled blocks when Urban retrieved them.
At the end of our first field season on the North Slope, we were rich in observations. However, we had not been able to collect a complete dataset of all of the processes typical to this environment, including the time-lapse imagery of erosion and a simultaneous record of the meteorological conditions and oceanography. We were eager to return.
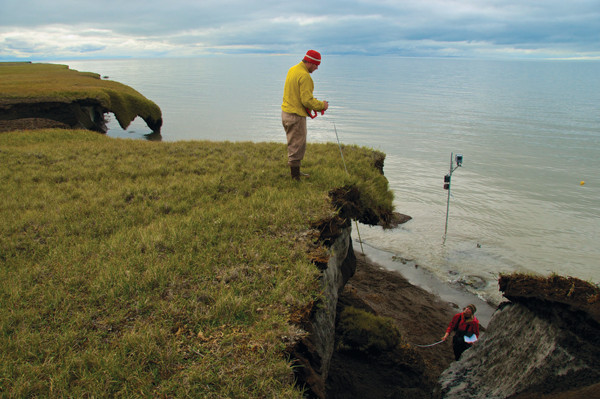
Urban and the author, Irina Overeem of the University of Colorado at Boulder, collect data on the geometry of the toppled blocks that will later be combined with the images from the time-lapse cameras. Credit: Adam LeWinter, Extreme Ice Survey.
In summer 2010, the pieces all came together. This time, we’d brought two sophisticated time-lapse cameras designed by photographer James Balog and engineer Adam LeWinter of the Extreme Ice Survey in Boulder, Colo. — the team behind the award-winning film “Chasing Ice” — who use them to monitor glaciers. We anchored the supporting poles for one of our cameras in the solid permafrost atop the coastal bluffs and set up the other camera on poles anchored offshore. This way, we would not only have a record from the shore looking outward, but also a view from the water. We would be able to see exactly what happens once a block fails.
The camera pole was equipped with temperature sensors and a pressure transducer to measure the water level. Wading into the frigid Arctic seawater to drill holes under water and install the pole proved quite challenging. To position the cameras high enough to get the best viewing angle toward the shoreline, we balanced on a small ladder perched on top of two stacked boxes, which were themselves resting on the slippery seafloor. I then waded 30 meters farther into the cold ocean to deploy the heavy wave sensor. Lastly, we took measurements of the eroded blocks’ sizes and shapes to use as baselines for our analysis of the images.
A few weeks later, our helicopter pilot spotted the equipment hanging off the eroding coast once again. Thankfully, he was able to retrieve both cameras before they fell into the water. Despite the setback, by the end of the 2010 season, we had finally collected all the pieces of the puzzle. We could now compare the combined field observations against predictions of the erosion processes from a computer model that we had developed along with University of Colorado graduate student Katy Barnhart.
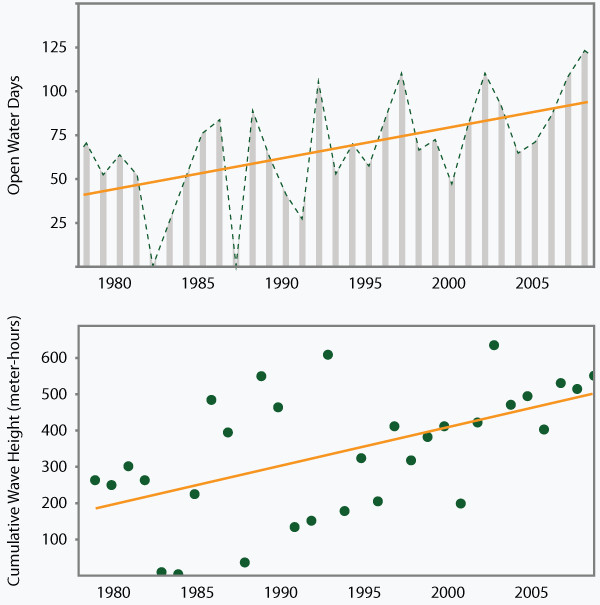
An increase in the number of open water days enlarges the window for large storms in to interact with the coastline. This change is reflected in greater wave heights and increased coastal erosion. Top: The number of open water days for the approximately 75-kilometer-long coastal zone along Beaufort Sea. Bottom: Modeled integrated wave height over open water seasons. Credit: Kathleen Cantner, AGI, after Overeem et al., Geophysical Research Letters (2011).
The integrated data indicated that the total annual erosion is controlled by episodic events. As we had observed in June, erosion occurs slowly as the sea ice begins to recede, despite long sun exposure. Although the seawater temperature sensors indicated that the seawater is warm enough in July and August to thaw the permafrost at the base of the bluffs, we could see from the time-lapse movies and water-level recordings that thawing happens quickly only when the water level increased during a storm due to wave height and storm surge. The most important control on erosion is how long the seawater is in contact with the base of the bluff. A longer duration of the open water season allows for more storms, many of which bring high water levels to the base of the coastal bluffs.
It is important to document and understand Arctic coastal erosion processes because they have immediate impacts on local infrastructure. Most communities in Northern Alaska are located along the coast, and some have become so vulnerable that they face the possibility of forced relocation. Archaeological sites like graveyards and old settlements are already being lost. And, potentially worse from an environmental standpoint, exploratory petroleum wells and military infrastructure abandoned long ago are now in jeopardy of being washed into the Beaufort Sea.
With continued warming, the processes responsible for erosion will only accelerate. Storms will bring more warm water to lick at the bases of the bluffs, causing more substrate, once permafrost, to thaw and slough away. Along sections of the Arctic coast with less permafrost, the melting may not be as severe, but saltwater inundation and flooding due to large storms are still of major concern in those areas. In our efforts, we are constantly refining our numerical models to improve predictions of these processes. Our newly developed computer model of coastal dynamics and erosion processes is the first model to retrieve the sea-ice edge on a daily basis from satellite observations and relate the edge location and the prevailing wind each day to the waves and water level at the coast. Important questions about the changes in sea-surface temperature remain, including how storms bring in colder water from farther offshore and if this mixing of water by storms dampens the rate of coastal erosion. We will have to explore those questions with coupled sea-ice, ocean and climate models, because the observational data on sea-surface temperature in the coastal zone is sparse.
A warmer future will likely mean more industrial activity and shipping in the Arctic. A longer sea-ice-free period will lengthen the shipping season, as well as the shoreline erosion season. In this future, coastal communities and the infrastructure built for these activities will need to be designed to accommodate a highly dynamic coast.
© 2008-2021. All rights reserved. Any copying, redistribution or retransmission of any of the contents of this service without the expressed written permission of the American Geosciences Institute is expressly prohibited. Click here for all copyright requests.