
by Steve Murray Friday, August 3, 2018
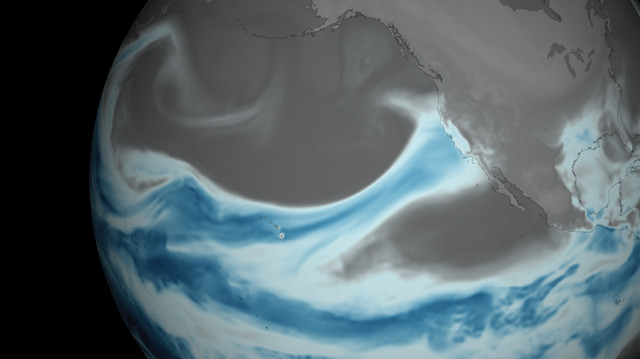
Atmospheric rivers are long, narrow weather systems that carry large amounts of moisture from the tropics into the midlatitudes. This NOAA illustration of a system stretching from the tropics around Hawaii to the U.S. West Coast, with darker blue shades representing greater amounts of precipitable water, depicts an atmospheric river that drenched Northern California in April 2018. Credit: NOAA National Environmental Satellite, Data, and Information Service.
In early February 2017, authorities in Northern California ordered more than 180,000 residents around the Oroville Dam to evacuate over concerns that heavy rains might cause the dam’s spillway to fail. The rains were brought by an atmospheric river (AR) — a long, narrow system of moist, tropical air that can deposit enormous amounts of water — adding to an already wet season for the U.S. West Coast. ARs occur around the planet, but certain regions — including western North America, where moisture from the tropics near Hawaii is repeatedly delivered by recurring “Pineapple Express” events — are especially prone.
Between October 2016 and March 2017, 45 ARs made landfall in California, according to researchers at the Scripps Institution of Oceanography (SIO) in San Diego. Of these, 12 were considered “strong” and another three were considered “extreme.” And in October 2017, an AR dubbed the “Big Dark” arrived in the Pacific Northwest, stayed more than a week, and dropped more than 25 centimeters of rain and snow. While timely and accurate predictions of these storms are vital for both public planning and emergency response, knowledge and data gaps exist in the weather science needed to provide them. New tools and theories, however, are now beginning to close them.
The term “atmospheric river” came into use in the early 1990s to characterize the shapes of these meteorological systems, which are typically several hundred kilometers wide, but can extend more than 1,600 kilometers. The “Big Dark,” for example, stretched for roughly 8,000 kilometers.
Warm tropical oceans feed moisture to the atmosphere through evaporation and increase its moisture-carrying capacity, which enables the air to move large amounts of water. Although ARs cover only about 10 percent of the planet at any given latitude, they are responsible for as much as 90 percent of the north-south water transport in the midlatitude atmosphere.
Rainfall from ARs accounts for 22 percent of runoff globally, a figure that rises to 50 percent in some regions like Southeast Asia, New Zealand, and the coasts of North America. “If you condense the total water vapor in an atmospheric river down to liquid, from the surface to space, it’s only about a centimeter or two deep,” says Marty Ralph, director of the Center for Western Weather and Water Extremes (CW3E) at SIO. Nevertheless, Ralph says that an average AR transports water at a rate of about 25 times that of the Mississippi River, and “there are about three or four ARs at any given time in the Northern Hemisphere.” While the U.S. West Coast sees a lot of atmospheric rivers, these systems can impact almost anywhere across the country. “ARs sometimes hit the East Coast and feed blizzards in the winter,” Ralph says, “and storms in the Great Plains and the Southeast can have ARs behind them.”
A 2013 review of European weather data collected between 1979 and 2011 found that up to 8 of the 10 largest daily rainfall events across parts of western Europe were due to ARs, and that these systems reach as far east as Germany and Poland. ARs have been linked to many of the largest winter floods in the U.K. in recent decades, and AR-driven storms in 2012 contributed to an estimated $1.6 billion in flood-related damages in the U.K.
ARs even reach Earth’s polar regions. In 2009, snowfall in East Antarctica broke records that stood for 60 years. When researchers examined satellite data covering the same period, they found the first evidence of an AR winding from Madagascar to the coast of East Antarctica, along with two other AR patterns that could account for heavy snowfalls in other regions of Antarctica.
Atmospheric rivers play an important role in Earth’s water cycle and can relieve periods of serious drought. Between 1950 and 2010, AR storms ended 40 percent of persistent droughts in California and 74 of persistent droughts in the Pacific Northwest. Balance, however, isn’t a strong characteristic of these weather systems. The same restorative rains that might end a dry spell can, in the same stroke, overload reservoirs and rivers and stress regional infrastructure.
California has an especially conflicted relationship with ARs. Soon after the moist air makes landfall, the state’s mountainous terrain pushes it upward — a process known as orographic lifting. As the rising air cools, it releases entrained moisture. As a result of AR-derived precipitation, California suffers an average of $300 million a year in flood damages. “Atmospheric rivers keep up both the water supply and the flood risk,” says Mike Anderson, California’s state climatologist. “Don’t think of it as flood or drought; think of it as flood and drought — all tied to this AR process.”
Most western states in the U.S. maintain agencies responsible for managing reservoirs, agriculture, transportation and emergency response activities — all of which are impacted by extreme weather. Policymakers administer plans, for example, regarding when to drain reservoirs in advance of heavy storms or when to hold onto water as a reserve against possible future drought. The challenge is to weigh the risk of flood damage against the waste of a vital resource. Although advance weather forecasts might offer timely guides for such decisions, they rarely offer the precision and accuracy needed for definitive action. California law, for example, requires managers to maintain a certain amount of free reservoir storage space during the winter rainy season in case of unexpected storms, regardless of the weather outlook, which at times forces needless releases of water.
“Most of the reservoir agencies in the West require water to be on the ground before a decision can be made to change the reservoir releases,” Ralph says. The relevant policies were enacted, however, “back when forecasts were uncertain enough that you didn’t know what the next day or two would bring. Our forecasts are getting better, so in the future, reservoir operators may be able to safely keep a little extra water in case a storm doesn’t materialize,” he says. “If a big storm is actually predicted, reservoirs could potentially release extra water that would normally be kept for the summer, knowing that the storm would replenish their supplies.” Ralph notes, for example, that an analysis he co-led with Jay Jasperse of the Sonoma County Water Agency determined, for example, that more accurate forecasting could save up to 25 million cubic meters of water biennially in Northern California’s Lake Mendocino Reservoir — enough to supply about 50,000 homes for a year.
Emergency response plans, which consider worst-case scenarios, are also often invoked without the best weather information. In March, an AR was tracking toward regions of Southern California that had suffered major damage the previous year from wildfires, including the Thomas Fire, the largest in the state’s history. Heavy rains would risk the kind of flash floods and mudslides on fire-ravaged lands that Santa Barbara County experienced in January, which killed 21 people and injured more than 160. In March, up to 30,000 people in three counties were ordered to evacuate. “What ended up happening,” Ralph says, “is that the heavy precipitation hit farther north, in Big Sur. The heaviest part of the storm missed Santa Barbara by maybe 200 to 250 kilometers.” While safety concerns understandably prevailed, better forecasting might have minimized public disruption in communities already experiencing evacuation fatigue.
Weather forecasting models integrate many interconnected factors across scales. Sea-surface temperatures, for example, affect how much moisture is delivered to the atmosphere and how much water it can carry. Large-scale climatological patterns, such as the El Niño-Southern Oscillation (ENSO), which impacts equatorial Pacific Ocean temperatures, also influence ARs over periods of several months to years. ENSO’s warm phase, called El Niño, raises sea-surface temperatures in the eastern Pacific while its cool phase, La Niña, has the opposite effect. The pattern can, in turn, modulate how strong, high-altitude winds known as Rossby waves interact with atmospheric pressure gradients, the Coriolis force and the jet stream. All of these interactions eventually influence where ARs make landfall.
The amount of precipitation an AR drops also depends on factors such as how much moisture it carries, the topography of the land it travels over, local temperatures and winds, and the duration of its passage. Not surprisingly, models that process all these factors are complex.
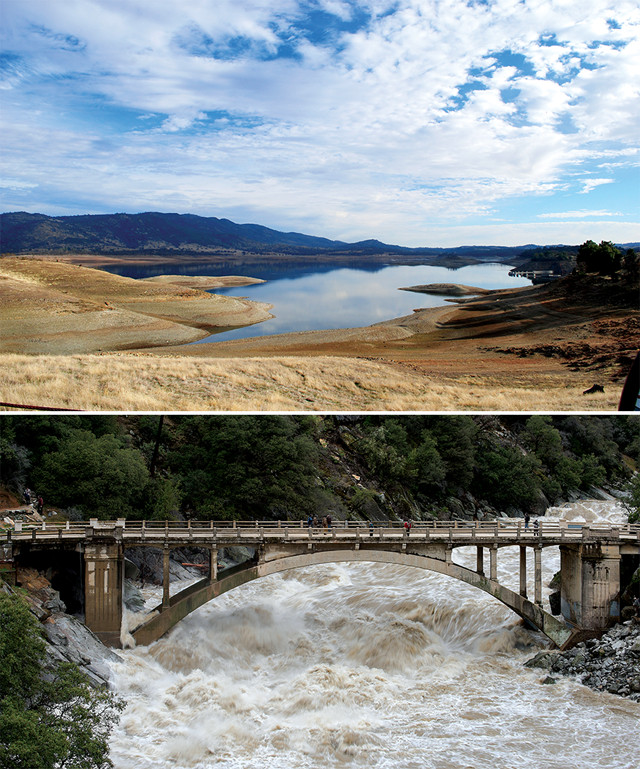
Atmospheric rivers can relieve periods of serious drought, but can, in the same stroke, overload reservoirs and rivers and stress infrastructure. Above: The water level at New Hogan Lake, a reservoir near Stockton, Calif., was low in winter 2014 amid a severe multiyear drought. Right: Three years later, in winter 2017, heavy rains brought by atmospheric rivers refilled reservoirs in the state and sent water pouring down the South Yuba and other rivers. Credit: top: U.S. Army Corps of Engineers; bottom: Kelly M. Grow, California Department of Water Resources.
Most forecasting models are developed and improved by running simulations using historical weather data as input conditions, and then comparing the model results to what actually happened. Operational weather forecasters use what are called ensemble predictions, says Christine Shields, an atmospheric scientist and paleoclimatologist at the National Center for Atmospheric Research in Boulder, Colo. This method creates probabilities for weather predictions based on multiple modeled outcomes rather than just a single model outcome. “That can give us a better basis for forecasting,” Shields explains. “You run a model several different times and tweak the way you initialize each one to add a bit of randomness. The result is an ensemble of solutions. Then you take a look at … where most of their predictions point and that’s your best forecast.”
Weather models that perform better than random forecasts are said to have “skill,” and skill is a function of how far into the future a forecast reaches. Currently, operational weather models demonstrate good skill out to two weeks, with better performance in the first week. “For weather forecasts, we use numerical models that derive their skill from accurate knowledge of the current state of the atmosphere,” says Cory Baggett, an atmospheric scientist at Colorado State University. “We only have skill in predicting ARs at lead times out to 14 days,” he says. Meanwhile, “for seasonal forecasts, we use large-scale climate features such as sea-surface temperature or the ENSO. Seasonal forecasts run from about two months to 12 months or beyond and have only fair skill.”
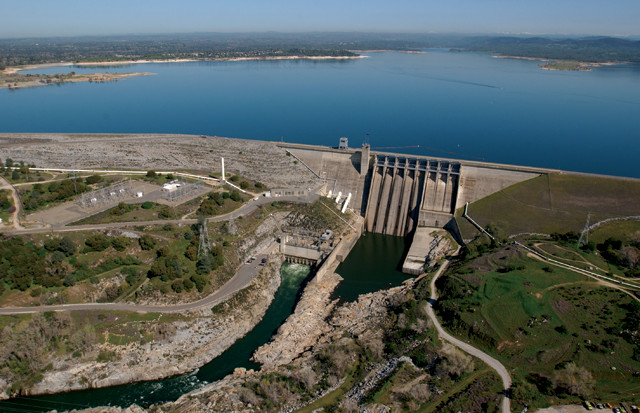
California law requires that a certain amount of free storage space be maintained in reservoirs, like Folsom Lake, during the winter rainy season in case of unexpected storms, regardless of the weather outlook, which could force needless releases of water. Improved forecasts could allow reservoir operators to decrease such releases, keeping more water in reservoirs when storms don't materialize. Credit: United States Army Corps of Engineers, Michael Nevins.
Between these short- and long-term forecasts is the seasonal-to-subseasonal (S2S) window, typically defined as two weeks to two months (although some definitions vary). “Skill is harder to come by” for S2S forecasts, Baggett says, as they combine data about atmospheric conditions that lie beyond the timeframe of operational weather forecasts with long-term data about climatic conditions. These midrange forecasts may be particularly useful in making informed decisions about reservoir storage and water management.
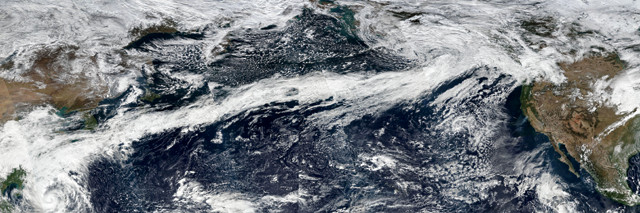
A roughly 8,000-kilometer-long atmospheric river extending from Asia to the Pacific Northwest was imaged by the Suomi NPP satellite on Oct. 14, 2017. Many interconnected factors influence where atmospheric rivers make landfall and how much precipitation they deliver. Credit: NASA Earth Observatory image by Joshua Stevens.
In May, the Western States Water Council (WSWC), an organization of water agencies for 12 states, met in San Diego to focus on better precipitation forecasting in the S2S timeframe. It’s a sobering problem. “The current state of forecasting capabilities at S2S timescales is not really useful for making water management decisions,” says Jeanine Jones, vice-chair of the WSWC. “The skill just isn’t there.”
Water resource managers monitor physical infrastructure like reservoirs, dams and spillways to ensure the effective allocation of water in their states. A lot of that infrastructure is aging, such as dams built before World War II (or even earlier), posing risks to downstream populations.
Virtually all of these states must also deal with drought. State laws typically give priority to human and livestock needs when water is scarce, but that can be of little comfort to other agricultural and economic interests. Managing the Colorado River Basin is especially complicated, as its water must meet the needs of seven western states. Most policies are based on the status of current water levels, and while networks of field sensors provide public managers with data for this purpose, reliable predictions of future water could simplify a lot of management challenges.
The May WSWC meeting allowed scientists to present new ideas and tools that might improve the situation. “What’s special about S2S forecasting right now,” says Anderson, “is that it’s coming into prominence because you have a meeting of the operational need with the technical capability.” If researchers continue developing that capability, he says, “we can actually get some usable results.”
Baggett is one researcher attempting to stretch the window of skillful AR forecasting past two weeks by including information about additional macroscale features of the atmosphere. Currently, the best measure of AR strength is an indicator called vertically integrated water vapor transport (IVT), which is the total amount of water vapor carried by an AR at all altitudes. Baggett is investigating the Madden-Julian Oscillation (MJO) and the Quasi-Biennial Oscillation (QBO) — two equatorial atmospheric patterns that appear to modulate the frequency at which ARs occur — to see whether knowledge of these phenomena could improve the IVT measure.
The MJO begins with tropical thunderstorms that lift enormous quantities of moist air via convection. When the rising air hits the tropopause, about 11 kilometers up, it encounters the jet stream, which then carries the moisture over the North Pacific to North America over a period of seven to 10 days (although it takes about 30 to 90 days for the oscillation to travel completely around the equator). The QBO is a consistent back-and-forth oscillation over the equator, about 50 kilometers up in the stratosphere. QBO winds alternate from east-blowing to west-blowing about every two to three years.
In the past few years, scientists have identified a statistical relationship between the phase of the QBO and the magnitude of the MJO. When the QBO is westerly, MJO convection is suppressed; when the QBO is easterly, MJO convection is enhanced. “So the MJO produces a wave train that sets up over the northern Pacific, which can enhance the number of ARs over the West Coast,” Baggett says. “Or it can block ARs and deflect them up toward Alaska. Just knowing the current state of the MJO can give us an idea of what ARs are going to do seven to 10 days from now.”
Baggett has been testing his ideas with historical AR data from 1979 to 2015 and comparing MJO activity during both easterly and westerly QBOs. The results have been encouraging out to three weeks, Baggett says. “In some cases, the skill extends out pretty well to four or five weeks.”
At CW3E, Ralph and his colleagues are also developing better AR forecasting by taking direct measurements of these systems while they’re still moving east over the ocean. For the past three years, CW3E and several collaborating agencies have sampled ARs over the Pacific one to three days before they make landfall. Two U.S. Air Force C-130 “hurricane hunters” and a NOAA Gulfstream IV fly over selected ocean tracks to release dropsondes — expendable sensor packages that measure temperature, pressure, wind speed and moisture as they descend. The group’s data have shown that the vertical and horizontal distribution of water vapor in ARs appears to be the largest single source of modeling errors — information that can be used to enhance future forecasts. Another round of flights is proposed for winter 2019.
Even as scientists gather and integrate new insights about weather dynamics into better forecasting models, a changing climate may be altering the rules of the game. While AR intensity has been linked to ocean-surface temperatures, those temperatures have increased worldwide by an average of about 0.6 degrees Celsius since the late 1940s. Because the atmosphere can hold about 7 percent more moisture for every 1-degree Celsius rise in its temperature, increased AR water vapor transport will almost certainly be part of future weather patterns. In fact, water vapor transport over land, including the water carried by ARs, has been increasing over the past 70 years, in keeping with warming of ocean surfaces.
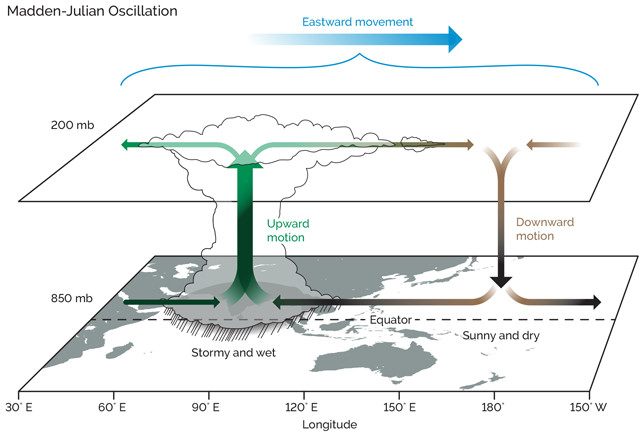
The structure of the Madden-Julian Oscillation (MJO), an eastward-moving equatorial atmospheric pattern characterized by adjacent regions of enhanced thunderstorms — caused by convection of moist air — and dry, sunny conditions. The MJO pattern takes about one to three months to circle the planet, and it may influence the frequency with which atmospheric rivers occur. Credit: Climate.gov drawing by Fiona Martin.
The ARs of 2017, for example, brought more moisture to California than the state had seen in any winter since at least 1948 — and that could be just an early salvo. “The 2016–2017 season that California went through was remarkable,” Baggett says. “I think most locations received more than 200 percent of their normal precipitation that winter. If you look at some of the records, however, there is concern that there are bigger events out there and bigger years waiting in the wings.”
Wet seasons may grow more volatile, as well as more intense. Two 2017 studies led by SIO scientists showed that California is experiencing increasingly dramatic swings in precipitation and projected that this variability will likely grow more extreme. In addition to making water management and flood protection more challenging, the state may also have to contend with longer dry periods between storms. Similar results have been predicted for northern Europe, as well.
At least one study of historical weather data since the 1980s shows a pattern of more winters with wet conditions in Northern Europe owing to more frequent ARs, but fewer wet winters in Southern Europe owing to changes in moisture transport. Increased AR water vapor transport may also lead to larger winter floods in Britain. Duane Waliser and his team at NASA’s Jet Propulsion Laboratory at Caltech in Pasadena, Calif., recently published work that systematically characterizes such global effects. The team created an atmospheric river database from over 20 years of global weather data and applied the database to a set of 21 models to evaluate how ARs responded in a future climate. The results suggested that the number of distinct AR events will decrease by 10 percent, but those that do occur will be 25 percent longer and 25 percent wider on average, and extreme events will carry more water. This means that locations will “experience AR conditions 40 to 50 percent more often. Even though there are fewer [events, they] get bigger, so taken together AR conditions occur more often,” he says. The results also indicated that the frequency of the most intense AR storms may nearly double. “This is the first study like this that’s been done globally,” Waliser says.
Weather prediction models have been improving with new data and methods. “We’ve figured out the mathematical equations for our numerical models pretty well,” Baggett says. But prediction is a tricky science, and “our equations rely on an accurate picture of what … the atmosphere looks like,” he says. “Until we are able to observe every cubic meter of it and model everything perfectly, there will always be limits to weather predictability.”
© 2008-2021. All rights reserved. Any copying, redistribution or retransmission of any of the contents of this service without the expressed written permission of the American Geosciences Institute is expressly prohibited. Click here for all copyright requests.