by Zahra Hirji Thursday, September 27, 2012

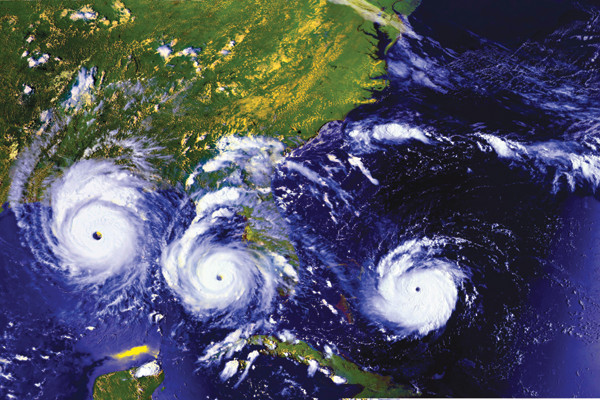
On Aug. 24, 1992, Hurricane Andrew (shown here in a time-lapse image) made landfall in Florida as a major storm. The cost of storm-related damages was predicted to be about $6 billion based on traditional actuarial models, versus $13 billion based on AIR's catastrophe models. The actual cost of damages was about $16 billion. NASA GSFC

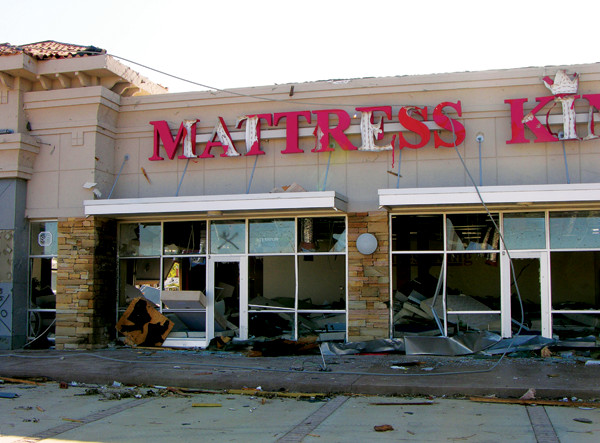
In 2011, insured losses from natural disasters in the United States totaled nearly $36 billion, with most of the losses coming from severe thunderstorm damage. In Alabama, tornadoes left a trail of destruction. AIR Worldwide

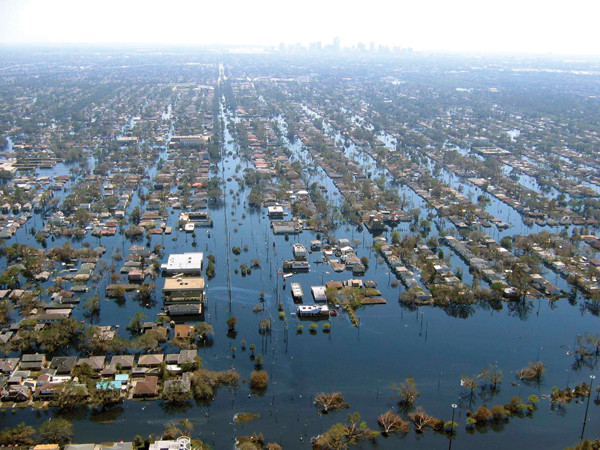
Hurricane Katrina, which made landfall on Aug. 26, 2005, remains the most expensive catastrophe ever in terms of insured losses, with $46 billion in insured losses. NOAA

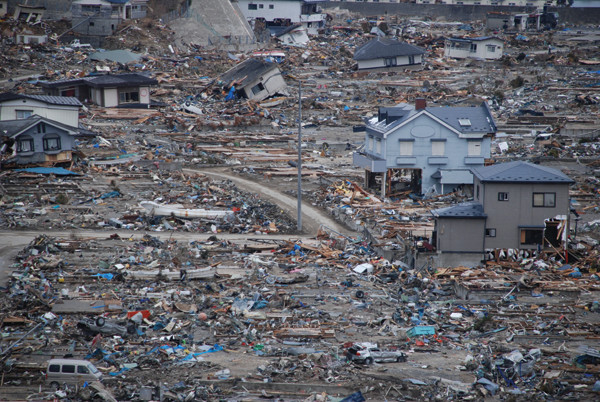
The magnitude-9.0 earthquake and subsequent tsunami in Japan on March 11, 2011, awakened the insurance industry to the potential costs of large tsunamis. The industry is now working to include tsunamis in earthquake cat models. Copyright Katherina Mueller, IFRC
Natural hazards — earthquakes, tropical cyclones and thunderstorms, for example — occur with considerable frequency around the world. Fortunately, most events are either not intense enough or too remote to cause damage. But the probability that a given natural hazard could become a natural disaster is higher today than at any previous point in history.
This rise in the probability of catastrophes is primarily a result of population growth, as opposed to changes in the frequency or intensity of natural hazards. As the number of people grows — currently about 7 billion — so does the infrastructure associated with the population, such as houses, bridges and cars. Thus, if a natural hazard strikes, there are simply more people and more things in harm’s way. Additionally, people are continuing to move to areas of high hazard, including wildland-urban interfaces such as in the canyons of Southern California and the hills of Boulder and Colorado Springs, Colo., and coastlines. Nearly 67 percent of the world’s population currently lives within 160 kilometers of a coastline, and that number is expected to reach 75 percent in the next couple of decades, according to the U.S. National Academies of Science.
The brunt of a natural hazard is felt locally, where earthquake ground shaking is most intense or hurricane winds are highest, but economic repercussions can reverberate internationally. The financial burden of catastrophes is largely shared between the private sector (including the insurance and reinsurance industries, the latter of which provides insurance for insurers) and the public sector (government); individuals contribute minimally too. Both sectors must agree on a value for the risk in order to manage it. To inform this process, industry players use tools known as catastrophe models, or simply “cat models,” to anticipate the likelihood and severity of potential future events.
Cat modeling has only been around for a couple of decades, but in that time it has changed rapidly. In tandem with worldwide changes in population growth, higher standards of living and climate change, this industry, which is unfamiliar to most people despite its major influence on our lives, is evolving at a breakneck pace.
Catastrophe models were initially designed to be insurance market tools. Today a wider audience, including governmental and nongovernmental development agencies, such as the World Bank, also uses them. To understand how and why these models are developed, it is important to first review the insurance industry’s relationship with catastrophes.
By pooling risk among many clients, insurance coverage lessens the financial impact of a disaster for individuals and businesses. For example, if you own a home and buy homeowner’s insurance that includes coverage for damage from hurricane force winds, you pay a premium each year. If a hurricane strikes and winds blow off your roof tiles, you can file a claim with your insurance company and potentially transfer most of the expense of a new roof, likely higher than your annual premium, onto the insurance company.
Prior to 1992, “insurers typically determined catastrophe insurance premiums using actuarial models,” says Guillermo Franco, head of catastrophe risk research for Europe, the Middle East and Africa at Guy Carpenter, a reinsurance intermediary. These purely statistical models accounted for historical event frequency and loss data. But they neglected to account for ongoing improvements in hurricane observation technology and the changing landscape of insured properties due to, for example, the development of new construction materials and buildings. In many cases, actuarial models were underestimating the loss potential.
Actuarial models were put to the test with Hurricane Andrew, which made landfall on Aug. 24, 1992, near Homestead, Fla. They failed. With wind speeds exceeding 240 kilometers per hour, Florida’s Atlantic coast experienced storm surges of 1.2 to 4.9 meters. The hurricane went on to strike Louisiana, buffeting the state with winds topping 160 kilometers per hour, heavy rain, tornadoes and 2.4-meter storm tides. The resulting damage was staggering: More than 25,500 homes were destroyed and more than 100,000 were damaged, according to the National Hurricane Center’s annual summary of the 1992 Atlantic hurricane season. In Homestead, 99 percent of mobile homes were destroyed.
Based on actuarial models, insurers predicted that insured losses would not exceed $6 billion (in 1992 dollars). Andrew ended up generating losses of more than $16 billion. Because no hurricane of that intensity had ever barreled into such a heavily populated and insured region before, Franco says, there was no real precedent for the scale of the damage. “No one [in the insurance industry] expected such high losses for Andrew … Unable to pay out the high number of insurance claims, at least 11 insurance companies collapsed following the hurricane,” Franco says. Consequently, thousands of people who had insurance were left unprotected and with little or no compensation for the damage.
Five years before Andrew, in 1987, economist Karen Clark had founded the first catastrophe modeling company: Applied Insurance Research. Now called AIR Worldwide, it is one of three leading cat modeling companies (Risk Management Solutions and EQECAT are the other two). Clark started the company after realizing the usefulness of modeling tropical storms using computers — a technique that was predominately used in academia at the time to study storms’ behavior and evolution — to estimate damage and loss.
The company’s first model evaluated hurricane risk in the United States; the full potential of the model was realized after Hurricane Andrew. AIR estimated that insured losses from the storm would be somewhere near $13 billion, meaning the company’s cat models were much closer to reality than actuarial models. Today, Franco says, “you cannot be a leading player in the [insurance] market without [these models].”
Catastrophe models simulate how a hazard develops and interacts with the built environment. No matter the type of hazard, all models are developed using the same general process involving the same three components: hazard, vulnerability and loss.
The first catastrophe model was designed to estimate the risk to U.S. property posed by hurricanes, because “most cat losses in the U.S. can be attributed to this peril,” Franco says. No single hazard type has historically been more costly or affected the U.S. more regularly. The 10 most costly hurricanes in the United States each generated more than $15 billion in insured losses (in 2011 dollars), according to AIR. And these loss totals do not even include flood damage, as that is covered by the federally administered National Flood Insurance Program. Hurricane Katrina remains the most expensive catastrophe ever in terms of insured losses (meaning the amount submitted in insurance claims), causing approximately $46 billion in damage (in 2010 dollars), according to a Property Casualty Insurers Association of America white paper. Moreover, Katrina ranks as the second-most-expensive disaster after Japan’s 2011 Tohoku earthquake in terms of total economic losses (a number that takes into account all event-related losses to companies, the government and individuals), with Katrina costing approximately $105.8 billion (in 2010 dollars), according to NOAA.
The hazard component of hurricane models is built using more diverse historical storm data than the actuarial models, including storm track path, direction and speed, as well as central pressures and wind speeds along the track. For each of these variables, model developers create probability distributions. “These probability distributions are used to produce a catalog of thousands of realistic simulated events,” says Peter Sousounis, senior principal scientist in the research and modeling department at AIR. Events are then grouped into “years” of activity, hypothetical years of catastrophes that could potentially happen. The collection of thousands of simulated years, called the stochastic catalog, indicates a wide range of potential hurricane activity.
For each modeled storm, wind intensities are simulated at each location along the storm’s path. This intensity calculation accounts for the physical dynamics of a storm, as well as the influence of a region’s geology and topography on storm behavior; mountains, for example, could break up a hurricane’s circulation, or increase hurricane-driven rain.
The modelers then review the stochastic catalog and weed out nondamaging storms. Damaging hurricanes are storms that strike populated areas, and all of the physical assets in these areas are referred to collectively as “exposure.” Catastrophe models have exposure databases built into them; some models offer users, such as insurance companies, the option to input their own exposure. For hurricane models, exposure generally refers to buildings. Model databases are updated every few years on average to accurately reflect current regional construction environments.
In the vulnerability and loss components of tropical cyclone models, “hazard intensity is translated into damage, and then damage is turned into loss,” says Cagdas Kafali, principal engineer in the research and modeling department at AIR. To calculate damage to buildings, engineers such as Kafali use information about the responses of different building types to varying wind or surge intensities. A masonry house better endures a hurricane than a wood one, for example. Similarly, tall commercial buildings — generally made of steel and concrete — better withstand hurricanes than wood or brick houses. In the end, engineers develop a vulnerability or damage function, a curve that relates intensity to damage.
Loss estimation “is a less straightforward task,” Kafali says. If a hurricane tears off 10 percent of a house’s roof tiles, for example, a roofer doing repairs may need to replace additional tiles as well depending on a number of issues, including the damage pattern, how tiles are interlocked or aesthetic concerns. To account for the disconnect between damage and loss, engineers consult historical claims data provided by insurance companies. Usually that information includes the type of building damaged and the damage details as well as end loss values.
The cat model’s ultimate output is the probability distribution of hurricane-driven losses, also called an exceedance probability curve. These probabilities can also be expressed as return periods. The loss expected from a hurricane (or a flood, earthquake or other natural hazard for that matter) with a return period of 10 years is likely to be exceeded one year out of every 10. The higher the return period, the less probable the event — and the higher the expected amount of loss. The model may indicate that for a given region, $70 million or more in insured losses due to hurricanes would be expected to result once every 50 years on average, while losses of $175 million or more would be expected, on average, once every 250 years.
Loss modeling also has its weaknesses, however, as we saw with Hurricane Katrina in August 2005. Save for a few scientists, almost no one — not the Gulf Coast communities, the U.S. government, the insurers and reinsurers, or the cat modelers — expected the levees to fail in New Orleans. As Hurricane Andrew had done in 1992, Hurricane Katrina set a new record for insured losses and exposed the inability of models to capture the effects of nonmodeled perils such as levee failures.
Catastrophe models are not intended to predict the parameters of future events exactly. Rather, they are used to produce reasonable estimates of the probability of various levels of loss. The effectiveness of such model predictions was recently demonstrated in Japan following the magnitude-9.0 Tohoku earthquake and associated tsunami. Although the levels of destruction following the quake were apocalyptic and scientists had not expected a rupture of that magnitude in that particular location, the resulting insured loss totals were within the range predicted by cat models for a damaging Japanese earthquake.
Climate change is emerging as an important issue in the insurance industry because it has the potential to change the risk associated with certain hazards. Currently, catastrophe models are built to capture the risk of today’s hazards. For most meteorological systems, this means that “cyclical climate variability — El Niño and La Niña, for example — is captured in the software,” Sousounis says. However, the gradual change of climate patterns, as is occurring with global warming, is not generally captured, he says. To date, a handful of meteorological models have been designed to account for limited trends associated with climate change, such as increasing sea-surface temperatures.
In November 2011, the Intergovernmental Panel on Climate Change released a report, titled “Managing the Risks of Extreme Events and Disasters to Advance Climate Change Adaptation,” which predicted that the number of intense tropical cyclones will increase in the future due to climate change, but that a decrease in overall storms is expected. The news that tropical cyclones may become more intense put the insurance industry on edge.
Hurricane models in the North Atlantic Basin are the first type of catastrophe model to address climate change, at least peripherally, says Ioana Dima, a meteorologist and senior scientist in AIR’s research and modeling department. “This started with the 2004 and 2005 hurricane seasons in the North Atlantic Basin,” which were two of the most active tropical cyclone seasons storm- and loss- wise, she says.
On average, the North Atlantic Basin experiences 11 tropical cyclones annually, of which six typically evolve into hurricanes. In 2004, there were 15 tropical cyclones and nine hurricanes. In 2005, there were 28 tropical cyclones and 15 hurricanes — more than twice the historical average. Hurricanes from these seasons, including Charley, Ivan, Frances, Katrina, Rita, and Wilma, all caused billions in insured losses. After these two hyperactive seasons, where sea-surface temperatures were slightly warmer than average, modelers and clients alike were asking the same questions: Did these seasons represent a new standard of North Atlantic Basin hurricane activity, and was climate change the culprit? In response, modelers began creating alternative event catalogs for warmer sea-surface temperatures to supplement their existing catalogs.
Although these additional catalogs provide a more expanded view of hurricane risk, at least for the North Atlantic Basin, they still do not fully capture the anticipated effects of climate change. For one thing, they don’t take into account higher sea levels and, thus, higher potential storm surges. In addition, Dima says, increasing sea-surface temperatures are not the only symptom of climate change likely to affect cyclones; another is changes in wind shear.
Low wind shear is an important ingredient in tropical cyclone development. Climate modeling indicates that a warmer atmosphere may significantly increase wind shear in the tropical Atlantic, which would inhibit hurricane development and intensification there. Thus, the influences of warming sea-surface temperatures and increasing wind shear on hurricane development are conflicting. As a result, there is much uncertainty as to how exactly global warming will impact future tropical cyclone genesis and development, she says.
In addition to tropical cyclones, insurers are interested in climate change’s current and future influence on severe thunderstorms. In 2011, only about $6 billion of the nearly $36 billion in insured catastrophe losses in the United States came from hurricanes, according to reinsurance company Munich Re. “Most of it came from severe thunderstorm events: hail and tornadoes,” says Kerry Emanuel, an atmospheric scientist at MIT interested in applied catastrophe modeling.
Emanuel, who has reviewed the U.S. hurricane models created by the big catastrophe modeling players and has his own hurricane-modeling business, is focusing more on thunderstorms these days. Similarly, cat modelers, including Dima, are also paying more attention to severe thunderstorms. Unfortunately, “the data for severe thunderstorms are not robust and this makes establishing trends difficult,” Dima says. “For now, the results are inconclusive, but it is a topic we will continue to research.”
In response to the increasing availability of higher-resolution data and powerful computers, models are becoming more complex, incorporating up-to-date scientific and exposure data, as well as more refined modeling technology. The constant expansion of these models, however, is having an unexpected backlash. As the models become more multifaceted, the challenge of educating model users about their appropriate use is also growing.
Emanuel sees this as a major challenge in the industry. “These models need to be more transparent,” he says. One way modelers can do this is to make details regarding the data sources, validation, and scientific assumptions and techniques that go into the models more available to the people purchasing natural disaster coverage from insurers. Of course, for cat modeling companies trying to make a profit, choosing to share information that could benefit the public without revealing too much proprietary information to competitors is a tricky balance.
Catastrophe modelers have also started reaching out to the general population. On some catastrophe modeling company websites, there are now detailed summaries and even risk assessment tools that quantify real-time disasters. At AIR, for instance, Dima has helped developed the ClimateCast U.S. Hurricane Risk Index, a tool that combines hazard information from the National Hurricane Center with the company’s U.S. hurricane model. Essentially, if a cyclone develops in the Atlantic Basin, ClimateCast tracks a storm’s potential risk of damage using a scale of zero to 10, where 10 is the highest risk level.
With greater documentation and tools like ClimateCast, catastrophe modelers are working to make their research and model results more accessible.
At only 25 years old, the catastrophe modeling industry is still young, with much room for growth and many emerging challenges to tackle. In addition to expanding and improving existing models, the industry is focused on tackling more complex hazards.
Spurred by the devastation of the 2004 Sumatra quake and Indian Ocean tsunami and last year’s Tohoku quake and tsunami, the industry is now developing earthquake-induced tsunami models. One of the main reasons tsunamis have not already been incorporated into existing earthquake models is that they are difficult to model due to their relative infrequency. Thousands of earthquakes occur every year, but tsunamis, especially large and destructive tsunamis, are rare. By relying more on the physics of tsunamis rather than the scarce historical record, modelers are aiming to enhance existing earthquake models with a tsunami component.
Beyond natural disasters, catastrophe modelers are branching into the realm of mass health crises such as pandemic diseases. Similar to tsunamis, full-fledged pandemics are uncommon, with only a few occurring every century. Yet, after the recent avian and swine flu scares, there is increasing interest in pandemic risk.
The catastrophe modeling industry may never get ahead of our growing population, Earth’s changing climate, or new sources of catastrophe risk. But the industry has and will continue to catch up by a breakthrough here and a leap there. It is impossible to see the future, but continued improvements and refinements to catastrophe modeling bring future natural hazards a little more into focus.
© 2008-2021. All rights reserved. Any copying, redistribution or retransmission of any of the contents of this service without the expressed written permission of the American Geosciences Institute is expressly prohibited. Click here for all copyright requests.