
by Mary Caperton Morton Tuesday, April 10, 2018
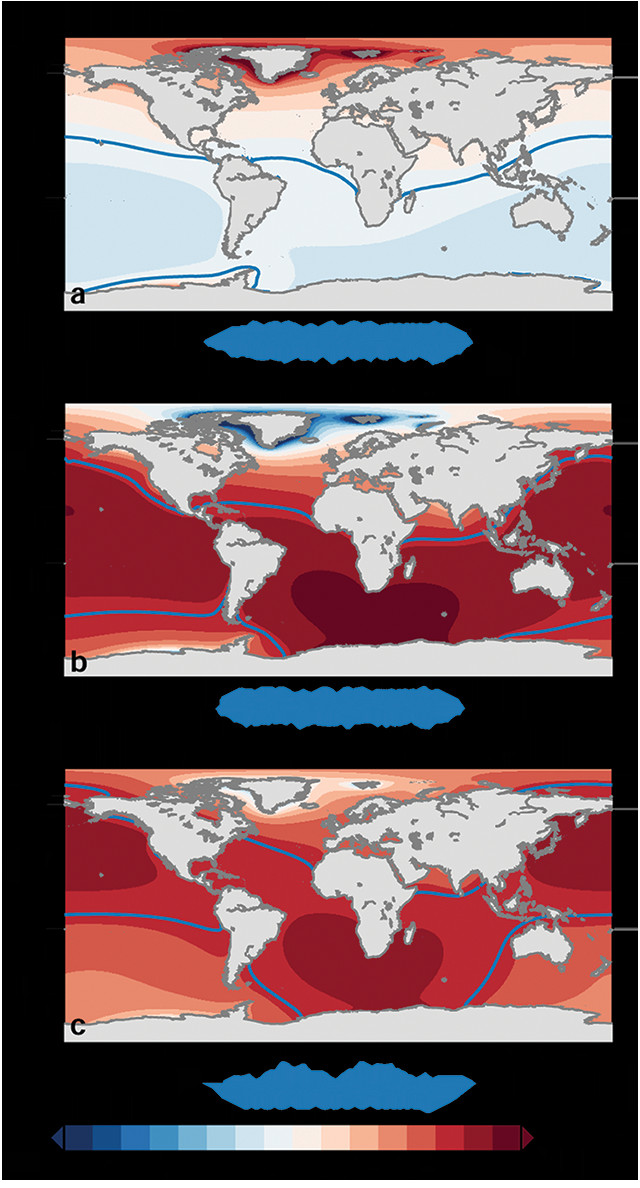
Estimates of ocean-bottom deformation (a), relative sea-level change (b), and geocentric, or absolute, sea-level change (c) between 1993 and 2014 are shown here. The weight of added water has depressed the seafloor globally by an average of about 0.13 millimeters per year (mm/y) over that time, according to new research, although the seafloor across far northern latitudes has actually risen due to melting ice and the redistribution of Arctic waters to areas south. Blue lines in each panel indicate where local change equals the average global ocean trend, the values of which are shown below each panel. Credit: Frederikse et al., Geophysical Research Letters, December 2017.
Predicting how much the ocean surface will rise in the coming years requires complicated, global-scale bookkeeping of the many factors that affect sea levels. In a new study, scientists have, for the first time, quantified the role of ocean-bottom deformation — the gradual deepening of ocean basins under the weight of more water — in both global and regional sea-level rise, an effort that may help produce more accurate sea-level projections.
Sea levels are rising due to two main factors: As the ocean absorbs excess heat from the atmosphere, seawater expands and increases in volume; and as glaciers and ice sheets melt, the additional freshwater boosts both the volume and the mass of the ocean.
“As the mass of the oceans gets heavier, the ocean bottom deforms under the weight,” says Thomas Frederikse, a geophysicist at the Delft University of Technology in the Netherlands and lead author of the new study, published in Geophysical Research Letters. “Everybody has always assumed that it affects sea-level rise by only a very small amount, but we wanted to take a closer look at its potential contribution.”
For centuries, sea levels have been tracked using tide gages, and, since the early 1990s, using satellite-mounted radar measurements. However, neither of these methods accounts for ocean-bottom deformation, says Don Chambers, a physical oceanographer at the University of South Florida St. Petersburg, who was not involved in the new study. “It’s not yet possible to track ocean-bottom deformation directly; it has to be done using modeling and this study has done a nice job of demonstrating how to do that.”
Frederikse’s team compiled previously published estimates of mass loss from glaciers and ice sheets and plugged those data into established models to calculate the rates of ocean-bottom elastic deformation. The researchers found that adding the mass of the meltwater to the oceans depressed the seafloor around the world by an average of about 2.5 millimeters between 1993 and 2014. “It’s quite a small amount, but it’s important to those of us who are trying to bookkeep every aspect of sea-level rise and understand all of the processes at work,” Chambers says. “We’re measuring changes at the surface of the ocean, but the bottom is sinking at the same time and we need to take that effect into account.” The Arctic is the exception to the overall trend toward ocean-bottom subsidence, however: Widespread ice melting and redistribution of the weight of lost ice are causing crustal rebound, leading much of the Arctic seafloor to rise by 1 millimeter per year or more since 1993.
This study is the first to quantify modern ocean-bottom deformation, but a similar elastic effect in Earth’s crust, known as glacial isostatic adjustment, has long been considered when modeling the impacts of ice loss after the last ice age, Frederikse says. That process results in deformation of both the land as it rebounds and the ocean bottom as it takes on mass. But glacial isostatic adjustment occurs over many thousands of years — Earth’s crust is still adjusting after the end of the last ice age about 11,000 years ago — while the elastic deformation quantified in Frederikse’s team’s study is much faster, happening in a matter of hours to days. Such timescales for deformation aren’t unheard of, he notes. “There are a lot of processes that continuously deform Earth. For example, Earth’s crust deforms by several centimeters twice a day as the tides go up and down.”
Overall, Frederikse and his colleagues found that estimates of sea-level rise derived from satellite measurements may be underestimating relative sea-level rise — what we actually experience along shorelines — by about 0.13 millimeters per year on average around the world. The team’s next step will be to incorporate ocean-bottom deformation into both global and regional sea-level rise calculations, he says. “We are still working on refining the sea-level budget, and this study puts us one step closer to accounting for all the possible contributing factors.”
© 2008-2021. All rights reserved. Any copying, redistribution or retransmission of any of the contents of this service without the expressed written permission of the American Geosciences Institute is expressly prohibited. Click here for all copyright requests.