
by John Stenmark Monday, April 14, 2014
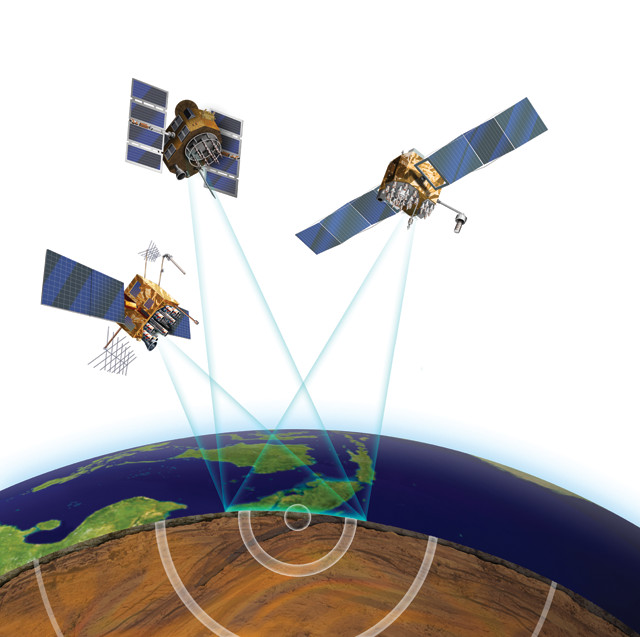
The Global Positioning System is a constellation of more than 30 satellites orbiting Earth twice a day at an altitude of more than 20,000 kilometers. Geoscientists use GPS to make precise measurements of position and ground motion. Credit: Kathleen Cantner, AGI
In the late 1980s, Ken Hudnut, a Columbia University graduate student studying plate tectonics in Southern California, began experimenting with a new technology, called the Global Positioning System (GPS), as a way to measure the slow, relentless motion of Earth’s crustal plates.
Measuring the motion of plates relative to each other is a key challenge in understanding plate tectonics. Scientists have long used seismometers to detect vibrations caused by the plates’ motion, especially during large events like earthquakes. Seismometers can also detect subtle motion and capture relatively small movements at high frequencies. But researchers need data, not just on the displacement resulting from an individual quake, but from the continuous, incremental and nearly undetectable shifts caused by tectonic motion.
Hudnut thought GPS could solve the problem.
Conceived in the 1960s as a system to provide positioning, navigation and timing for the U.S. military, today’s GPS system includes a constellation of more than 30 satellites orbiting Earth. Each satellite continuously broadcasts information such as its orbital parameters and precise time. On the ground, a GPS receiver captures signals from the satellites, using the information to determine its distance from each satellite. By doing this for three or more satellites, a receiver can compute its position in three dimensions.
During Hudnut’s years at Columbia, GPS began making its way into practical applications, and geodetic scientists developed methods that used GPS to measure distances with a precision of a few millimeters. Soon, its potential was being realized by early adopters in surveying, oil and gas exploration, and geophysical research, all of whom shared the need to make precise measurements between points on Earth that were often great distances apart and located in difficult terrain.
In 1987, the U.S. Geological Survey (USGS) began using GPS to gather precise position data on the ground in earthquake-prone areas in California, including along the San Andreas Fault and around San Francisco Bay.
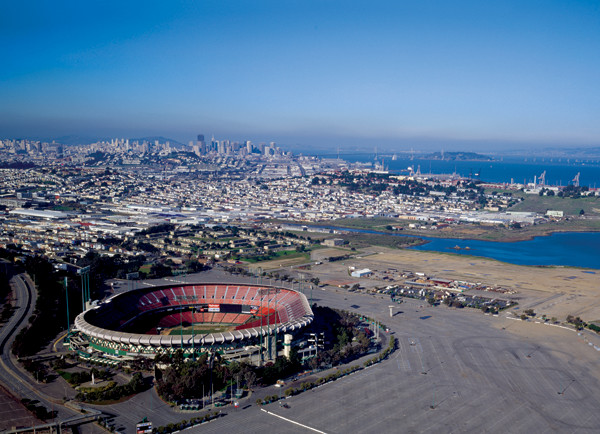
The first major test of GPS as a seismic tool occurred on Oct. 17, 1989, when the Loma Prieta earthquake struck San Francisco just as the third game of the World Series was about to begin at Candlestick Park. The series was suspended for 10 days while engineers verified that the stadium was structurally sound. Credit: Carol M. Highsmith Archive, Library of Congress
The first big test of the new method came in October 1989, when the magnitude-7.1 Loma Prieta earthquake struck San Francisco. The quake, which hit 30 minutes before the scheduled start of the third game of the World Series at Candlestick Park, killed 63 people and caused $6 billion in damage. Soon after the quake, Hudnut, his colleagues and USGS researchers converged on the quake zone to remeasure as many of the markers as they could. USGS geologists Mike Lisowski, Will Prescott, Jim Savage and Malcolm Johnston compared the pre- and post-quake GPS data to reveal the direction and speed of surface movements. The information allowed them to infer the pattern of slip on the fault plane that had ruptured far underground.
GPS had proved its worth. Whereas strain gauges, trenching and other approaches provide useful information on crustal motion, only GPS could provide scientists with precise measurements of both large- and small-scale displacements.
In the years since the Loma Prieta quake, geophysicists have developed methods to describe deformation of the crust related to faults using three types of motion: interseismic, coseismic and post-seismic. Interseismic motion is the slow movement along faults that takes place over the long intervals between earthquakes. This motion is evidence of strain accumulating or deformation occurring in Earth’s crust and provides clues to where earthquakes might next occur. Coseismic motion is rapid displacement that occurs at the time of an earthquake. Post-seismic motion takes place in the days to months after a quake as the crust adjusts and returns to a relatively stable state. By using GPS equipment and software and two different methods, scientists can measure all three types of motion to a precision of a few millimeters.
In the first method, called the “campaign” method of GPS observation, researchers establish a series of monitoring points and make periodic visits to measure the points’ positions. During each visit, they install a portable GPS receiver to collect satellite data for several hours or days.
“You set up your GPS receiver for a period of time to make observations and then come back again maybe a year later to reobserve the same mark,” explains Hudnut, who moved to USGS in 1992. “Through time you accumulate enough measurements so you can track plate tectonic movements.” This works best for measuring interseismic motion.
Capturing coseismic and post-seismic motion requires data at intervals far shorter than the months or years between GPS campaigns. In the second method, called “continuous GPS” or cGPS, researchers use networks of permanently installed GPS receivers to collect continuous data at intervals down to one second or less. The method provides temporally dense data that make it possible to measure displacement both during an earthquake and after.
More recently, continuous GPS techniques have also enabled scientists to study a different type of crustal movement: slow-slip motion along a fault.
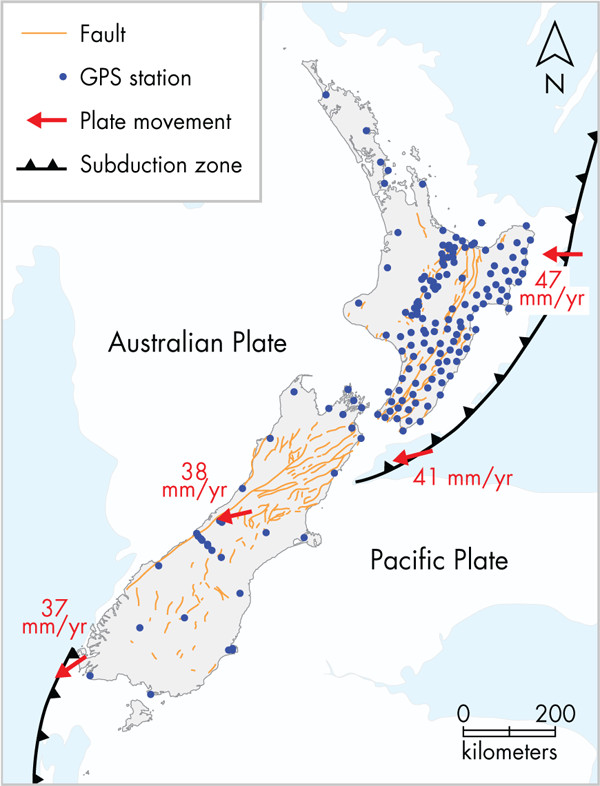
New Zealand lies on a plate boundary that includes two oppositely directed subduction zones and a major transform fault. A network of GPS stations provides continuous observations of the North and South islands. Credit: Kathleen Cantner, AGI
First characterized about 10 years ago in Cascadia by Canadian scientists, slow-slip motion is episodic movement across a fault that releases energy on timescales of hours to weeks rather than seconds to minutes as occurs in earthquakes. Since slow-slip events were first discovered, installation of continuous GPS at subduction zones around the planet has led to an explosion of observations of this form of fault slip.
One area found to be experiencing a variety of slow-slip movements is the Hikurangi Subduction Zone offshore of the North Island of New Zealand, where the Pacific Plate is diving beneath the Australian Plate.
“ew Zealand has a network of more than 150 cGPS reference stations, called GeoNet, arrayed across its two islands. Laura Wallace, a geophysicist at t"e University of Texas Institute for Geophysics and formerly of GNS Science in New Zealand, and colleagues analyzed data collected across large portions of the North Island over more than decade. Wallace’s team reported in 2010 in the Journal of Geophysical Research that the cGPS data revealed slow-slip events occurring about once every five years, lasting up to a year, at depths of 30 to 50 kilometers at the southern end of the Hikurangi Subduction Zone. By contrast, at the northern end of the Hikurangi zone, the data revealed shallow slow-slip events at depths of 5 to 15 kilometers below the seabed (and possibly even shallower) that occur every year or two, often over just one to two weeks.
“If the slip in these events were to happen in a single earthquake, you’d be looking at something equivalent to a magnitude 6.5 to 7,” Wallace says. “By using continuous GPS, we’ve found that a huge component of the plate motion at the Hikurangi Subduction Zone is accommodated by these slow-slip events, much more so than at a lot of other subduction zones.”
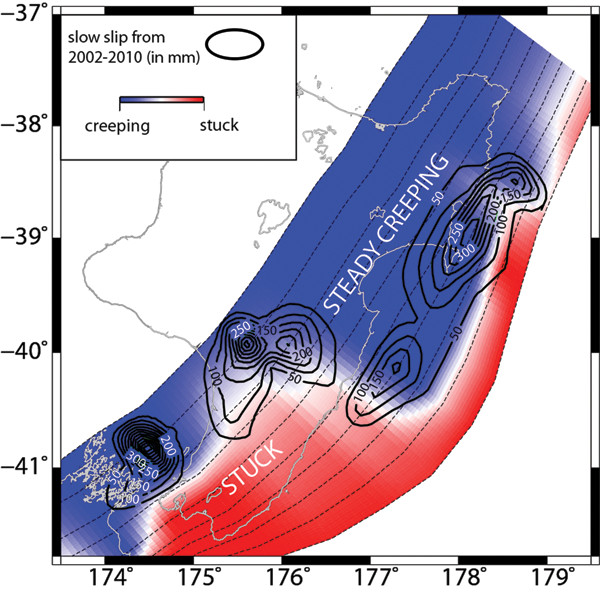
Map of New Zealand's North Island showing slow slip over an eight-year period. GPS campaigns have revealed that elastic strain is accumulating in the locked area, which lies below the capital city of Wellington. Farther to the north, however, the subduction interface beneath the North Island is slowly slipping. Credit: Laura Wallace
While the northern part of the Hikurangi zone seems to be steadily slipping and thus not accumulating much stress, the southern part — which lies below the nation’s capital, Wellington — appears to be locked at a depth of about 30 or 40 kilometers. Using campaign GPS, Wallace and her team found that “there is a lot of elastic strain accumulating in the southern North Island due to the locking of the fault, which could be relieved one day in a large earthquake,” Wallace says.
Currently, researchers suspect that both high fluid pressures and the frictional properties of the rocks in the fault zone influence slow-slip motion, but the exact mechanism remains unknown.
The shallow depths of the northern Hikurangi slow-slip zone offer researchers a rare opportunity — to drill into the slip zone and retrieve samples that could help them understand the causes of slow-slip movement.
Wallace is working with a large international team to develop proposals for the International Ocean Discovery Program (IODP, formerly the Integrated Ocean Drilling Program) to use the Japanese scientific drilling vessel Chikyu. In addition to collecting core samples, Wallace’s team is proposing to install instruments to sense hydrological changes and deformation in the boreholes and to place seafloor pressure sensors and seismometers in th” area to provide a better understanding of slow slip along the offshore portio" of the plate boundary.
In addition to illuminating the Hikurangi Subduction Zone in New Zealand, slow-slip studies have affected seismic monitoring around the world. Some researchers have suggested that slow slip might actually cause increases in shear stress on nearby locked portions of the fault that could trigger larger subduction earthquakes. Japanese researchers have found evidence that a nearby slow-slip event may have preceded the main rupture of the 2011 magnitude-9.0 Tohoku earthquake in northern Japan. “That may have played some role in triggering the bigger quake,” Wallace says. “So it’s really important to monitor where and when these slow-slip events are happening.”
In 2003, a team led by Purdue University geophysicist Eric Calais (now at Ecole Normale Supérieure in France) conducted campaign GPS measurements in Haiti. Using data from 35 points around the country, Calais determined that a major fault just a few kilometers from the capital of Port-au-Prince was accumulating elastic strain — and causing crustal shear — at a rate of about 7 millimeters per year. The last major earthquakes in Haiti had occurred in 1770 and 1751, and the data showed that roughly 1.9 meters of deformation had been caused by the strain that had built up in the ensuing 250 years. While there was no way to predict when a quake might occur, the team computed that releasing that amount of strain would produce a quake of magnitude 7.2. In January 2010, Haiti experienced a devastating magnitude-7 earthquake. Calais’ magnitude forecast, based on the GPS measurements, was nearly spot on.
Within a few days after the quake, Calais returned to Haiti to locate and remeasure as many of the 35 points as possible. The teams needed to move quickly to begin the measurements after the quake to characterize coseismic motion before it could be masked by post-seismic slip and motions from aftershocks.
Using GPS equipment provided by UNAVCO — a university-governed consortium in Boulder, Colo., that uses an array of technologies including GPS, borehole geophysics and georeferenced imaging to support geoscience research — Calais and his colleagues gathered data to develop a 3D-view of speed and direction at each location. Closest to the epicenter, they measured surface displacement of up to half a meter. At sites 200 kilometers from the epicenter, the displacement vectors were less than 1 centimeter. In analyzing the vectors, the team found that the quake produced both lateral and vertical shifting. The quake was originally suspected to have occurred on a nearby strike-slip fault, where predominantly lateral motion would be expected. Thus, the GPS data indicating a vertical component of motion demonstrated that the quake did not occur on that fault.
Similar activities in Chile produced detailed data about the February 2010 Maule quake near Santiago. At the time of the quake, Chile’s network of monitoring points was denser than the network in Haiti, enabling teams to collect larger datasets and at more locations. The campaign GPS data collected after the quake showed surface motion of 4.5 meters horizontally near the epicenter and uplift of up to 2 meters in some areas. After the quake, research teams from the U.S. and Europe installed 25 new cGPS stations, which will provide data to study the longer-term behavior of Chilean fault zones.
The value of using GPS in active fault zones may already be evident, but it is also increasingly being put to use in regions where earthquakes aren’t as frequent.
The problem with locations that produce infrequent earthquakes, says Rick Bennett, a ge"physicist at the University of Arizona, is the lack of evidence left in the geologic record. It’s possible to see faults and sometimes even evidence of old quakes deep below ground, but at the surface, erosion has often destroyed evidence of earthquakes. That doesn’t mean these locations are safe from seismic activity, however.
“or example, southern Arizona is not known to b” seismically active. But recently, a team led by Bennett found evidence of a fault scarp near Tucson that is thought to have produced two or more magnitude-7 earthquakes about 100,000 years ago. Bennett’s team had collected GPS data on markers set near Tucson more than two decades ago by the U.S. National Geodetic Survey. When compared with measurements made in the late 1990s, the data revealed a relatively localized zone of deformation that is not far from a prominent fault scarp south of Tucson.
But there’s very little evidence for recent earthquakes in the areas around the fault. “We don’t understand how those earthquakes fit into the greater Pacific-North America plate boundary zone,” Bennett says. So the team turned to GPS and added seismic information collected during oil exploration; they found that strain is accumulating.
“When we made the measurements,” Bennett says, “it was quite surprising to see differences in the velocities of individual points of about a millimeter per year across the Tucson area, which includes this fault scarp.” That indicates to them that strain has been accumulating on the fault. If that rate has been consistent over the last 100,000 years, the fault would have accumulated 100 meters of slip deficit. Yet there has been no quake."
The research suggests that the model for determining the long-term average strain rate may not be correct, Bennett says. The behavior may be more like a car in traffic: Sometimes it moves fast and other times it moves slowly."
Other locations that lack evidence of recent quakes have proved similarly surprising. For example, in 1811–1812 a series of mid-continent quakes that rocked New Madrid, Mo., were felt across the South and Midwest. Prior to the quakes, there was little surface evidence to suggest the area might be seismically active, and no quakes had occurred in recent memory. Similarly, the 2010–2011 sequence of quakes near Christchurch, New Zealand, was a su"prise, Wallace says, mainly because there was no surface evidence of the faults that caused it. Just because a large earthquake hasn’" occurred in some location during recent human history “doesn’t necessarily mean there is no hazard,” Bennett says.
As GPS data accumulate over the coming decades, the increasingly dense strain measurements will enable scientists to better estimate the location and strength of potential quakes. The combined science of geodesy, seismology and geophysics can result in improved hazard models for understanding and mitigating the effects of major earthquakes. “GPS and geodesy is the one way that we can identify those hot spots that haven’t revealed themselves through earthquakes,” Bennett says.
GPS has completed the transition from military technology to essential tool of geophysics. In addition to seismic studies, scientists use GPS to measure changes in Earth’s surface resulting from volcanic unrest, melting ice, groundwater extraction and carbon sequestration. According to Ken Hudnut, the vast array of GPS data geoscientists have accumulated benefits not only science, but also the millions of people living close to fault systems. “We’ve been able to leverage scientifically motivated observation tools to help build better emergency response capability,” he says. “Having the observational capability of GPS is a very good thing.”
© 2008-2021. All rights reserved. Any copying, redistribution or retransmission of any of the contents of this service without the expressed written permission of the American Geosciences Institute is expressly prohibited. Click here for all copyright requests.