
by Bethany Augliere Wednesday, February 13, 2019
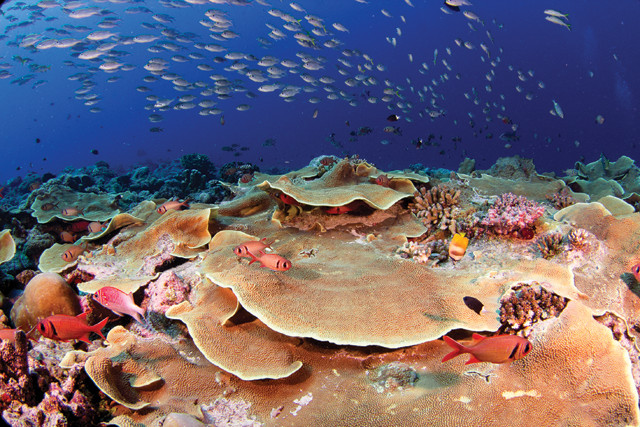
Reefscape from Koror State, Palau. Credit: Brian Zgliczynski, 100 Island Challenge (100IC), Scripps Institution of Oceanography (Scripps).
Today, news of damaged or devastated coral reefs has become commonplace. Reefs face many threats, including bleaching, disease, overfishing, pollution and even invasive species. While the fates of the reefs may seem almost universally bleak, some scientists think the future of these vital marine ecosystems could be more complicated — and perhaps even hopeful.
Ecologist Stuart Sandin, director of the Center for Marine Biodiversity and Conservation at the Scripps Institution of Oceanography in La Jolla, Calif., studies how and why reefs change over time and how best to manage them in light of looming threats. To understand clearly what’s happening in the oceans, Sandin and his team travel to remote islands around the world, take thousands of images of local reefs, and then stitch them together into three-dimensional photomosaics. They’ve been using this method for seven years, and to their surprise, what they’ve found is not all doom-and-gloom. In fact, they have observed coral reefs rebounding and growing as soon as two years after massive bleaching events.
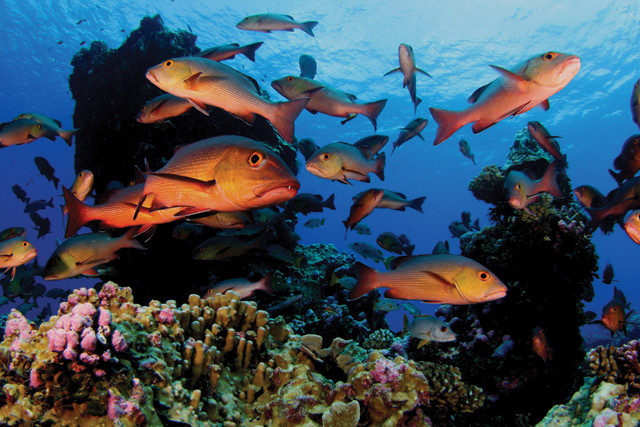
A school of twinspot snapper swims above a reef in the Republic of Kiribati. Not only do the members of the 100 Island Challenge (100IC) team survey and photograph the reefs, they also take visual censuses of fish populations to determine their abundance, size and species diversity. Credit: Brian Zgliczynski, 100IC, Scripps.
“If we were looking for change by just jumping in the water, swimming around and trying to remember what we saw yesterday, last year or five years ago, we’d only see loss,” Sandin says. “The only things that happen fast and obviously are giant bleaching events, big anchor damage or hurricane damage.” But by comparing high-resolution photomosaics over time, he says, he and his colleagues can look at small changes and speed up time, which allows them to see growth on centimeter scales.
One of the biggest challenges in studying reefs, however, is that each one is unique. Thus, no two reefs react the same way to environmental pressures and changing conditions. Sandin’s goal — to map, photograph and describe what’s happening to reefs around the world — required a cooperative global effort, he says. In 2012, he and a small team started working on the project, and in 2016, they formally launched the 100 Island Challenge (100IC), a collaborative project based at Scripps that involves visiting 100 islands, twice each, in five years. The hope is that by surveying and comparing sites using traditional survey methods combined with advanced imaging technology, scientists can better understand coral reef growth and change under different conditions, and thereafter develop best practices for reef management and conservation.
“One of the reasons that we took on the 100 Island Challenge is to create a standardized program,” Sandin says. “We want to show that you can get really interesting cross-regional comparisons if you collect data the same way.”
They chose 100 islands in three regions — the tropical Pacific, the Indian Ocean and the Caribbean — that span a range of habitats and conditions. Sandin and his team wanted to examine three different factors impacting coral reef structure and diversity: human population density on the host island, geomorphology of the island and ocean conditions, especially temperature, nutrient load and wave energy. Within each region, they chose islands with the goal of capturing as much variability in these conditions as possible.
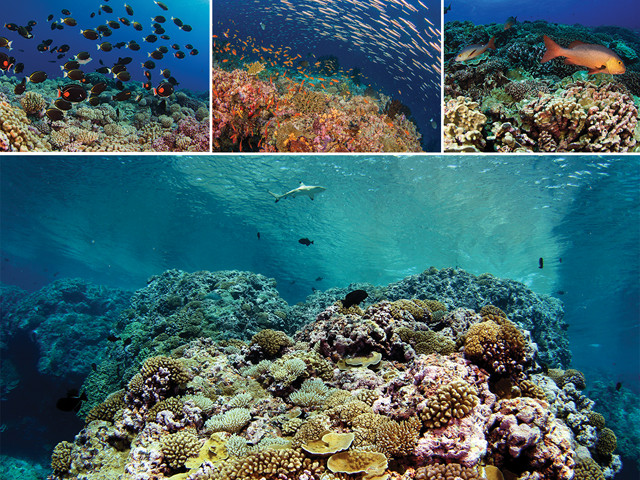
The 100IC team takes high-resolution photographs of reefs as they survey 10-by-10-meter plots by swimming transect lines. They then stitch the photos together to make three-dimensional photomosaics. Left top: Surgeonfish at Takapoto in French Polynesia; middle: Reefscape with several different schools of fish in the Maldives; right top: Twinspot snapper at Millennium Atoll in the Republic of Kiribati. below: Reefscape at Millennium Atoll. Credit: all: Brian Zgliczynski, 100IC, Scripps.
They chose topographically high islands (usually islands of volcanic origin) and low islands (typically formed from remnants of coral reefs); islands with high or low biological productivity, as determined by satellite-detected chlorophyll data; and islands with large populations and human influence as well as unpopulated islands. Volcanic islands, for example, tend to have more people because they are more suitable for development, and they also have greater habitat diversity offshore. To make statistically significant comparisons, the scientists needed enough islands with variation in those factors. In addition, at each island, they chose study locations that they thought they would be able to revisit easily, which often meant picking sites on the leeward side of islands that are not exposed to storm events. Finally, for the sake of meaningful comparisons, they opted to survey reefs at about the same water depth at each of the 100 islands.
Sandin’s team initially compiled a list of 135 islands, adding and changing the list as colleagues heard about the plan and offered suggestions for places to research. As Sandin and his team narrowed the list, they began contacting local agencies and nongovernmental organizations to set up the work.
Once the 100IC team chose the islands, they tried to find local collaborators. The team didn’t want to “just swoop in and do helicopter science,” Sandin says, but rather build on the work that local scientists and agencies were already doing. Now, the team works with more than 200 collaborators in 20 countries to conduct two surveys of each island within a two- to three-year period.
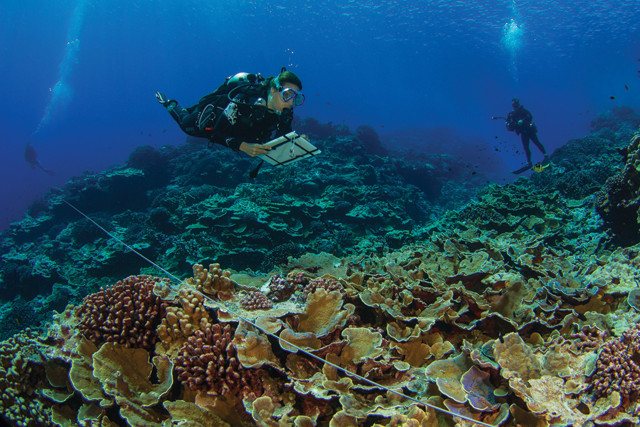
Collaborator Charlotte Moritz conducts a fish survey along a transect at Millennium Atoll in the Republic of Kiribati. Credit: Brian Zgliczynski, 100IC, Scripps.
The task of coordinating the team’s efforts to make 200 field trips in five years fell to Brian Zgliczynski, a coral reef biologist also at Scripps, who has visited about 60 of the islands himself, working with local collaborators and helping conduct the team’s underwater research.
The project finished up its second year at the end of 2018, with the first survey for 86 islands completed. “It’s been very busy, we are constantly moving forward and trying to get as many of the sites done as possible. As you can imagine, the logistical challenges are always difficult,” Zgliczynski says. “I’ve quit four times already,” he jokes.
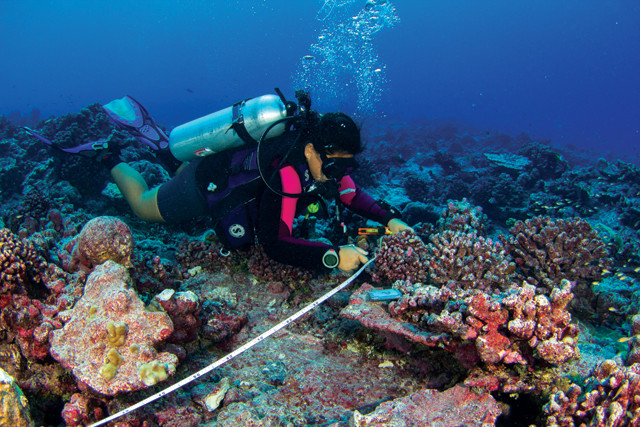
Collaborator Marguerite Taiarui surveys corals in Kiritimati. Credit: Brian Zgliczynski, 100IC, Scripps.
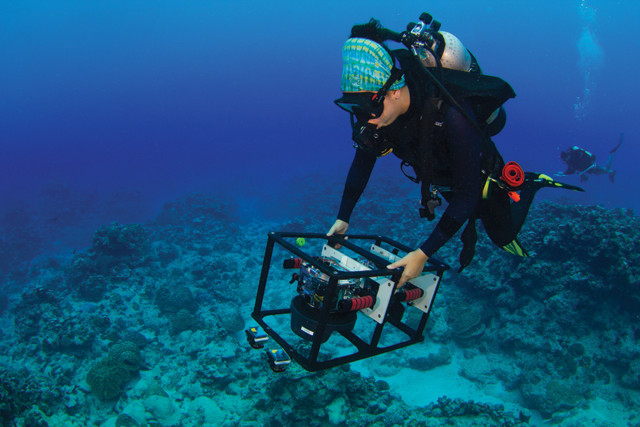
At each reef, the team has two main goals: to collect data on the species diversity, abundance and size of fish communities inhabiting the reef environment, and to characterize the makeup of the reef itself, including corals and algae. At a subset of plots at each site, the team also deploys temperature sensors, which take measurements every 45 minutes for two years.
At each site, the scientists survey about 12 to 15 plots measuring 10-by-10-meters each. A research diver on the team, often Zgliczynski, takes a camera underwater, dives down to about 10 meters depth, and swims transect lines back and forth about a meter above the reef. The camera is set to take one photo every second, and “then we just mow the lawn,” Zgliczynski says. After the first set of parallel transects is completed, the diver conducts a second set perpendicular to the first. “The critical part of this is to make sure that, after each photo, the subsequent photo captures about 80 percent overlap” with the preceding one, he says, which allows the computer algorithm to match adjacent images.
The process typically results in a few thousand images. To stitch them together into a single photomosaic, the algorithm looks at every photo and the pixels along their edges. Then it matches the images pixel by pixel. “Rather than just merging images together where you kind of fudge it a little bit — like in a panorama shot taken by a smartphone camera — this gives you a more precise estimate of the data in the image,” Zgliczynski says.
The final three-dimensional photomosaic might show 2,000 to 3,000 coral colonies that can be tracked and studied over time, which is how the 100IC team has been able to see growth, even at very small scales. “That’s amazing to me,” Zgliczynski says. “We are getting a pretty good representation of what’s happening on each island.”
Nicole Pedersen, image digitization coordinator for the 100IC team, conducts a photomosaic survey at Rarotonga in the Cook Islands. Credit: Brian Zgliczynski, 100IC, Scripps.
For instance, one of the reefs the team is studying is off the Micronesian island of Kiritimati, also known as Christmas Island, in the Republic of Kiribati about 240 kilometers north of the equator. Kiritimati is the world’s largest coral atoll. During the 2015–2016 El Niño event, the area experienced sea-surface temperatures 1.5 to 3 degrees Celsius higher than normal for 10 months, according to data reported by climatologist Kim Cobb of Georgia Tech and colleagues in 2016. As of November 2015, 50 to 90 percent of Kiritimati’s corals were bleached, and 30 percent were dead.
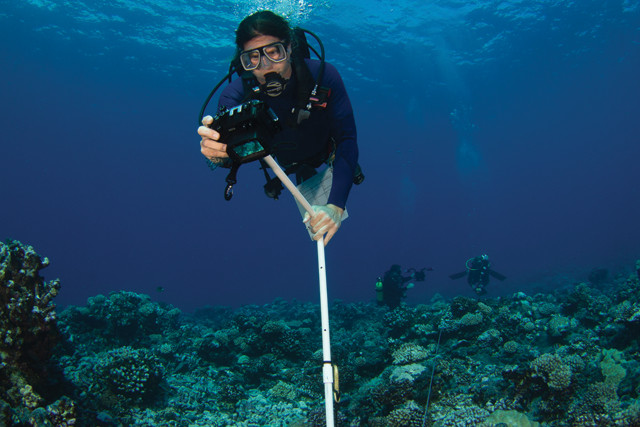
Stuart Sandin, principal investigator of the 100IC team, conducts benthic photoquadrant surveys at Rarotonga in the Cook Islands. Credit: Brian Zgliczynski, 100IC, Scripps.
But when the 100IC team went to Kiritimati in 2018, they saw new corals growing. “We didn’t expect to go to some of these remote places that experienced utter death and destruction, and see [corals] come back,” Zgliczynski says. They also saw healthy coralline algae — algae that produce a hard skeleton — which help cement reefs and provide habitat for juvenile coral to grow. “The reef got hit hard and the corals do not look like they did five years ago, but we’re starting to see life come back,” he says.
Such work has only been made possible by recent advances in technology, including increases in computer processing power and data storage. On each dive, the researchers collect thousands of high-resolution photos amounting to about 200 gigabytes of data. The researchers don’t even need to wait to get back to the lab to process all of the images to create the photomosaics. They can do much of the processing right after a dive on a small laptop, affectionately nicknamed Piglet, that they bring into the field. “By the end of our trip, we can show colleagues what we saw,” Zgliczynski says.
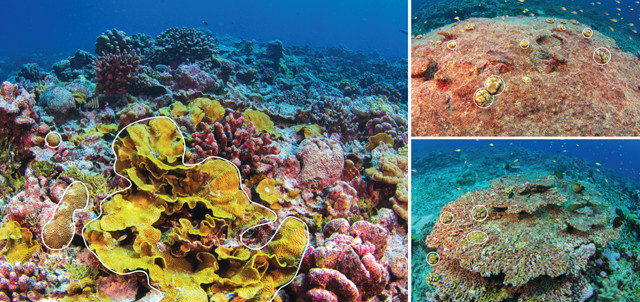
Signs of regrowth and recovery are often overlooked. Here, outlined in white, juvenile corals are growing on top of corals that suffered mortality during the last bleaching event. Credit: all: Brian Zgliczynski, 100IC, Scripps.
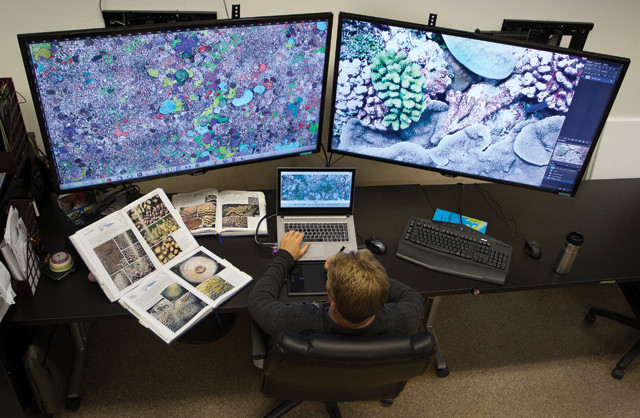
But to process all the images and create high-resolution photomosaics and models of the reefs, “we have six big desktop computers in our lab, [the type] that would make any gamer drool,” Zgliczynski says. They run extensive algorithms to create two-dimensional and three-dimensional models of the reefs. While the laptop takes 24 to 36 hours to process one model at moderate resolution, the lab computers can process one super high-resolution three-dimensional model in 12 hours and can process six at a time. The laptop is less efficient at processing, he says, but being able to see moderate-resolution models one to two days after collecting the photos “is extremely helpful and helps communicate our mission to our collaborators,” he says.
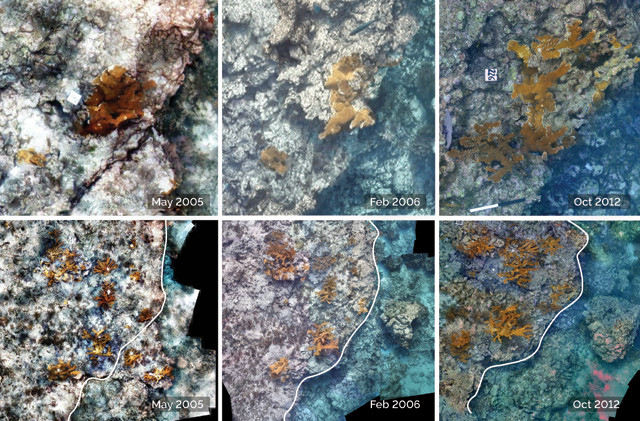
These underwater close-up images (top) and photomosaics (below) of elkhorn coral at Molasses Reef in Florida reveal massive erosion and destruction (delineated in white) between the first mosaic in May 2005 and the second in February 2006, caused by hurricanes Dennis, Katrina, Rita and Wilma. Live coral tissue is orange in color in these images. The hurricanes broke branches off individual colonies and caused an 8-cubic-meter boulder to calve off the side of the reef spur. By the time a third mosaic was taken in October 2012, considerable recovery could be seen, as evidenced by increased colony diameter and area of live coral tissue. Note also the increased quality of the imagery between 2006 and 2012, which is a result of improved imaging technology (digital video tapes versus DSLR). Credit: all: Art Gleason; 2005-2006 images modified from Gleason et al., Marine Ecology, 2007, and used with permission from John Wiley & Sons.
The 100IC team has partnered with geophysicist Art Gleason of the University of Miami in Florida, who pioneered photomosaic technology for use underwater about 15 years ago along with computer scientist Nuno Gracias, now at the University of Girona in Spain, and others.
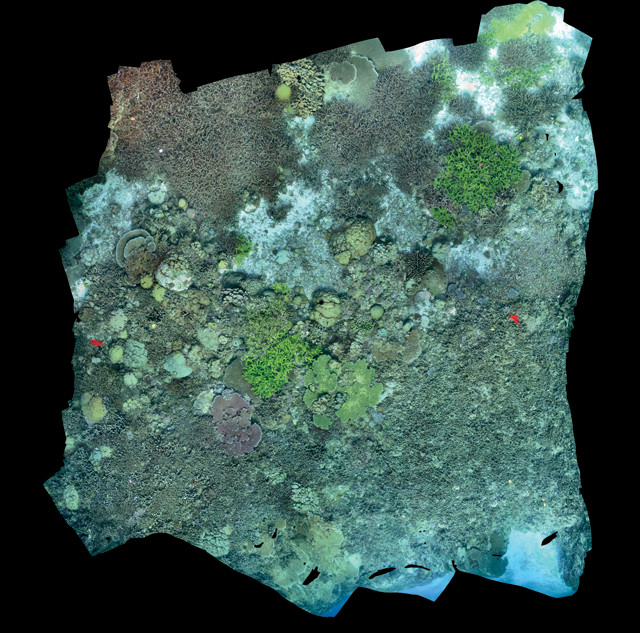
This large-area image, or orthomosaic, created by the 100IC team shows a section of reef in the Solomon Islands. Credit: 100IC, Scripps.
While people had been stitching images together to create mosaics of the terrestrial world, primarily in forestry and even archaeology, for years, the method hadn’t been used in the marine environment, Gleason says. “We were among the first people to realize that this would be a useful tool for coral reef science,” he says.
Ecologist Clint Edwards of the 100 Island Challenge team identifies and tags corals to collect demographic information through time. Credit: Rozy Edwards, 100IC, Scripps.
Back in 2000, a photographer took photos of an underwater wall (a sharp edge of a reef) off the Grand Cayman Island. In three days of diving, the photographer took roughly 200 photos, which then required about two years to stitch together. “It was beautiful and gorgeous and noteworthy enough to get published in National Geographic magazine, but it was a giant effort,” Gleason says. Prior to digital cameras, “hardware was limited by film — only 36 images per dive on a roll of film — and then by batteries and storage in the early years of digital,” he says. “Now, that hardware limitation is pretty much gone. We can easily collect many thousands of images in just a few minutes with great inexpensive cameras.” Also at that time, he adds, software was limited by the need to manually match and align overlapping images, which was very time-consuming to do by hand. Now, algorithms can stitch images together in an hour.
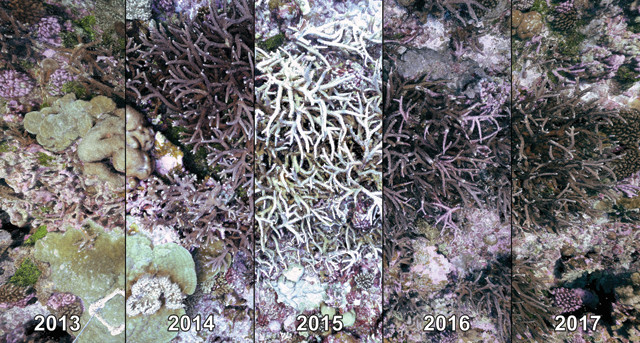
Time series of a section of reef at Palmyra Atoll illustrating how reefs change through time. A warm-water event caused widespread coral bleaching across the Pacific in 2015, but the reef is recovering. Credit: 100IC, Scripps.
Gleason wants to help make the underwater photomosaic tool available around the world, so it can be used to produce datasets that are comparable even if they are collected by different people at different times and different places. “One of the main advantages of the photomosaic technology is that you can answer many different questions with the same dataset,” Gleason says.
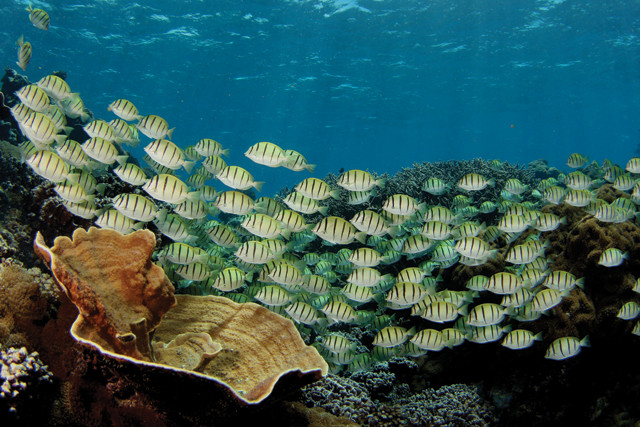
Convict surgeonfish forage along the reef at Palmyra Atoll in the U.S. Minor Outlying Islands south of Hawaii. Credit: Brian Zgliczynski, 100IC, Scripps.
Sandin agrees; and the 100IC team has made all of its data and photographs available: Raw images are provided to colleagues and data from the imagery is provided to local collaborators and colleagues, while two-dimensional orthophotos and three-dimensional video flyovers are available to the public. The standardized protocol for data collection that the team created is intended to help reveal what’s happening to reefs globally. And because the approach is standardized, the researchers can train local collaborators to follow the same techniques, thus helping advance science in countries with fewer resources. “We have this opportunity to help get them into the conversation, through democratization of data streams,” Sandin says. “We need to empower people who care about their backyard to do something about it.”
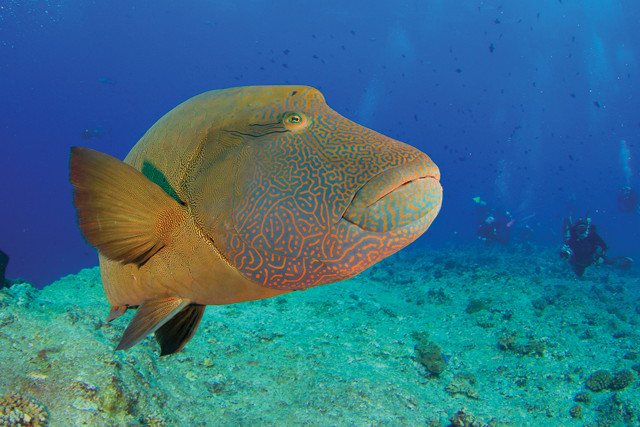
A giant humphead wrasse investigates divers in Palau. Credit: Brian Zgliczynski, 100IC, Scripps.
In Jamaica, for example, the reefs have struggled from the impacts of overfishing. Local anglers have taken action and created 16 fish sanctuaries around reefs. They are also planting corals to rebuild reefs. “It is slow, it is hard, and no, it’s not stunning or something out of a Scuba Diver magazine article,” Sandin says. “But they are getting their fish back. They just need tools and access to information” — which the 100IC team provides.
The 100IC team also has a bigger goal beyond getting to each island twice in five years: helping their collaborators continue reef-monitoring efforts once the Challenge is complete. To do that, Zgliczynski says, the researchers are raising money to support workshops and education about the data collection process, and to purchase camera systems. Then, he says, they hope to set up a repository where collaborators can send their data and have the 100IC team or another group create the models. The expensive part of this work is purchasing and setting up the computers to create the models and photomosaics, Zgliczynski says, “and we want to make it so not everyone needs these kinds of computers to process their images.”
“Our plan wasn’t to have this project go on forever with us directly involved,” Zgliczynski says. “The hope is that our collaborators embrace the technology we are using and continue to do the work in perpetuity.”
Although we have featured some stunning photos of reefs in this article, the photos can only show so much. Check out the 100 Island Challenge team’s YouTube page (www.youtube.com/channel/UCR6xc-3SFGmqdYthU8VrgsQ) to see some spectacular three-dimensional views of reefs around the world. You can also check out some photomosaics — including some stark before-and-after images — through the interactive work of Art Gleason and his colleagues at web2.physics.miami.edu/~agleason/mosaic_results/. Learn more about the 100 Island Challenge at: 100islandchallenge.org/overview/.
© 2008-2021. All rights reserved. Any copying, redistribution or retransmission of any of the contents of this service without the expressed written permission of the American Geosciences Institute is expressly prohibited. Click here for all copyright requests.