
by Harvey Leifert Tuesday, December 23, 2014
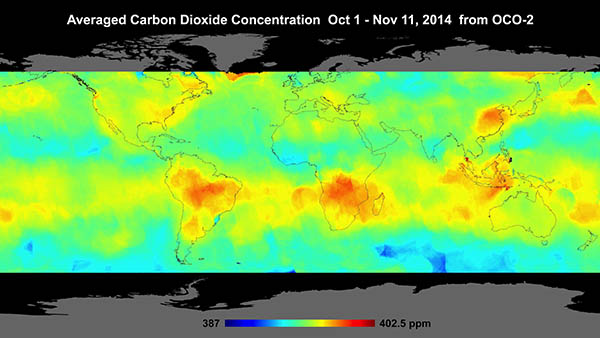
The first map produced by the Orbiting Carbon Observatory-2 mission shows atmospheric carbon dioxide concentrations, averaged over a five-week window, around the planet. Credit: NASA/JPL-Caltech
A recently launched satellite is now measuring atmospheric carbon dioxide with greater precision than ever before. Launched on July 2, the Orbiting Carbon Observatory-2 (OCO-2) is already mapping levels of carbon dioxide, the presence of which in the air constantly varies by region and over time. It has also validated a new technique of analysis that was not even contemplated when the mission was planned, according to scientists who discussed the mission at a press conference last Thursday during the annual meeting of the American Geophysical Union (AGU) in San Francisco.
Annmarie Eldering, deputy project scientist for OCO-2 at NASA’s Jet Propulsion Laboratory (JPL) in Pasadena, Calif., described the mission’s intent as gathering the measurements needed to obtain the “first complete picture of the geographical distribution and seasonal variations of human and natural sources of carbon dioxide, [as well as] the places where that carbon dioxide is removed or absorbed” from the atmosphere.
In 2009, the original OCO mission failed to deploy properly during launch. The current mission, Eldering said, was pieced together mostly using back-up materials that were already available. The instruments aboard OCO-2 began reporting science data in early September. The mission has a planned duration of two years, but Eldering expressed optimism that it would operate far longer.
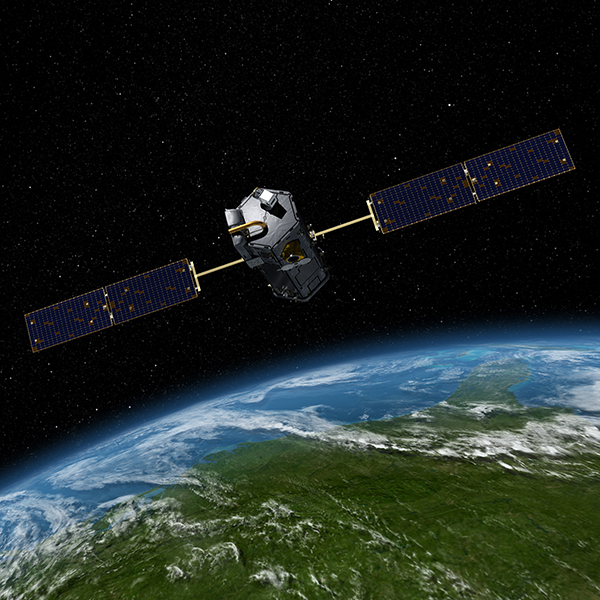
An artist's rendering of the OCO-2 satellite. Credit: NASA/JPL-Caltech
OCO-2 takes 16 days to cover the entire globe, collecting data over one narrow swath at a time with a resolution of about 2.6 square kilometers for a given measurement. Many of the data OCO-2 collects are discarded due to cloud cover or other factors that render them unreliable. Coverage at high latitudes is also complicated due to the angle of the sun. Still, Eldering noted, OCO-2 takes tens of thousands of useful measurements daily, “a very large number.”
OCO-2 also has the capacity to focus on a particular location for about seven minutes at a time, taking thousands of observations as it approaches, passes over and moves past its target. To do so, the entire satellite swivels, keeping its gaze pointed at one spot on the surface. This maneuver is helpful in calibrating the instrument against accurate, ground-based measurements taken at sites in the existing Total Carbon Column Observing Network, an international consortium in operation for five years.
Although the average global atmospheric concentration of carbon dioxide is currently around 400 parts per million, that carbon dioxide isn’t evenly distributed around the globe. OCO-2 can recognize variations of just one or two parts per million, “a pretty demanding requirement,” Eldering said. The first OCO-2 global map, including averaged levels measured between Oct. 1 and Nov. 11, 2014, was released during the AGU meeting.
The map demonstrates how unevenly carbon dioxide is distributed around the world. Far southern latitudes show low carbon dioxide concentrations, for example, whereas southern Africa and northern South America show high concentrations, possibly related to biomass burning, Eldering said. She noted that other satellites had recorded high carbon monoxide levels in those same areas, suggesting that fires were the source of both gases.
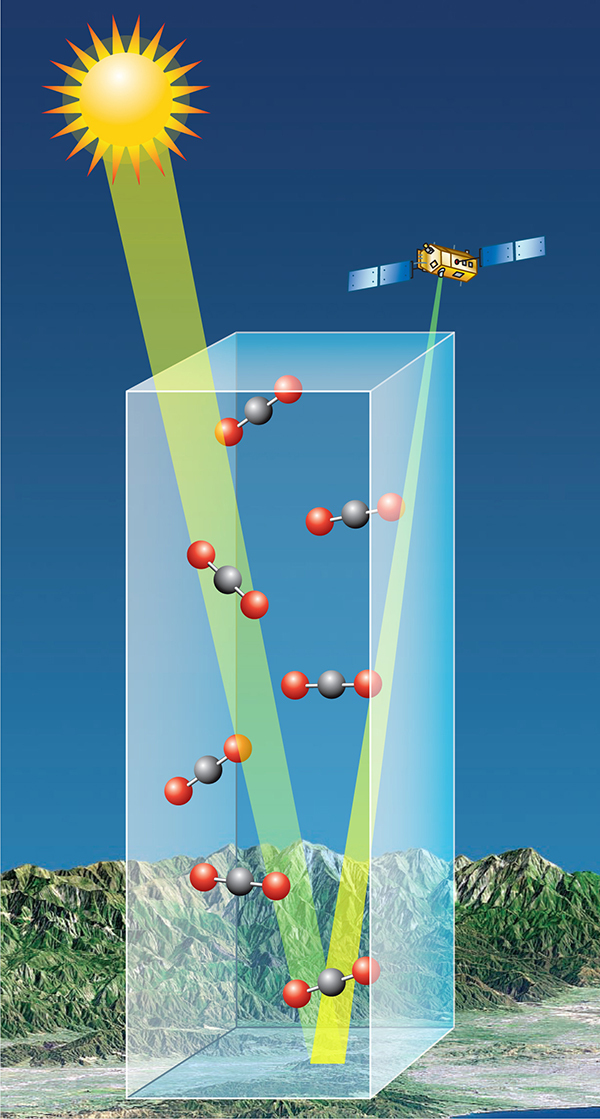
Spectrometers aboard OCO-2 detect carbon dioxide in Earth's atmosphere. Credit: NASA/JPL-Caltech, Debbi McLean, GSFC
OCO-2 carries three high-resolution spectrometers packaged into a single instrument, each of which detects different wavelengths of light. One of the spectrometers is capable of seeing through moderately thick clouds. It’s this instrument that is offering researchers a new and originally unplanned data stream. Christian Frankenberg of JPL told reporters that the spectrometer detects evidence of photosynthesis occurring within green leaves and can thereby provide data on carbon dioxide exchanges in places where cloud cover precludes other space-based observations, such as the Amazon Basin.
In photosynthesis, plants absorb carbon dioxide from air, and with the aid of sunlight and water convert it to oxygen and sugar. But about 1 percent of the sunlight is emitted back into the atmosphere at longer wavelengths, a phenomenon called solar-induced chlorophyll fluorescence, Frankenberg said. “What we pick up with OCO-2 is the fluorescence emanating from the chlorophyll complex inside a plant leaf,” he said. And “in the context of OCO-2, this is really useful information,” because it helps determine how much carbon dioxide is taken up by plants, as well as precisely when and where plants are drawing the gas from the atmosphere.
The new map presented at AGU showed how much this uptake varies seasonally as crops grow, are harvested, wither, and then, sometimes, burned. “Where OCO-2 really excels,” Frankenberg said in a statement, is in “the sheer amount of data being collected within a day… For fluorescence, this enables us, for the first time, to look at features on the 5- to 10-kilometer scale on a daily basis.”
Eldering emphasized that the data presented at AGU are preliminary, and that the longer OCO-2 operates, the more refined its output will become. The first public release of OCO-2 data is planned for Dec. 30, 2014.
© 2008-2021. All rights reserved. Any copying, redistribution or retransmission of any of the contents of this service without the expressed written permission of the American Geosciences Institute is expressly prohibited. Click here for all copyright requests.