
by Timothy Oleson Tuesday, August 15, 2017
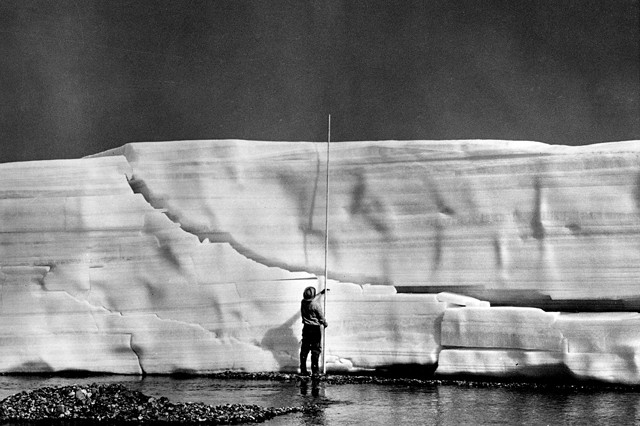
River icings, like this 5-meter-thick one on the Echooka River in Alaska in 1972, are large masses of ice that form each winter in and around rivers across the Arctic. New research suggests river icings in Alaska and Canada are melting earlier in the year. Credit: U.S. Geological Survey.
From Antarctica to the Arctic; from polar caps, permafrost and glaciers to ocean-rafted sea ice; and from burly bears to cold-loving microbes, fascinating science is found in every nook and crevasse of Earth’s cryosphere, and new findings are announced often. Here are a few of the latest updates.
An unusually large and prolonged episode of glacial melting in West Antarctica in January 2016 was likely caused in large part by the strong El Niño pattern at the time, according to a study in Nature Communications. Using satellite imagery, Julien Nicolas of Ohio State University and colleagues observed surface ice melting over roughly 775,000 square kilometers — an area larger than Texas — including most of the Ross Ice Shelf. Some areas experienced more than 14 melt days in the month. Data from ground instrumentation suggested that weather related to El Niño, which pushes warm water, air and winds from the Pacific toward West Antarctica, prevailed over the region while the melting was occurring. Westerly winds associated with the Southern Annular Mode — a climate pattern describing the variable winds that circle Antarctica — often counteract the warming effects of El Niño on West Antarctica. But in January 2016, El Niño won out despite strong westerlies at the time, Nicolas’ team reported.
River icings are large masses of ice — covering as much as 10 square kilometers and up to 10 meters thick — that form annually in and around rivers across the Arctic during winter. In a new study in Geophysical Research Letters, researchers have found that in parts of Alaska and Canada these icings are disappearing almost a month earlier on average than they did in 2000. Based on daily satellite imagery collected from 2000 to 2015, Tamlin Pavelsky, of the University of North Carolina at Chapel Hill, and Jay Zarnetske, of Michigan State University, analyzed 147 river icing features. Over that time, they found that 122 of these features, which typically melted completely each year, were doing so about 26 days earlier on average. Meanwhile, 14 of the 25 features that persisted year-round shrank in size by about 2.6 percent per year over the observation period. Although not all the features showed significant changes in melt timing or size, the researchers noted that none were melting later in the year or had grown larger.
Glaciers and ice sheets terminating in seawater are known to melt from the bottom up as relatively warm seawater flows past and under the deep, submerged portions of the ice. This seawater can reach the deep ice because the frigid and fresh meltwater running out from under glaciers, which would otherwise block access to the base of the ice, is less dense than the saline ocean despite being colder, so the meltwater rises toward the ocean surface. In a new study in the Journal of Geophysical Research: Earth Surface, researchers have found, however, that this same process doesn’t necessarily play out for glaciers terminating in lakes. Shin Sugiyama of Hokkaido University in Japan and colleagues studied three freshwater lakes that receive glaciers from the Southern Patagonia Ice Field. They observed that meltwater runoff from the glaciers pooled at the bottoms of the lakes rather than rising to the surface, thus suggesting that melting at the base of the ice-water interface is limited in the case of these lake-calving glaciers. The researchers found that this deep pooling of runoff occurs because water density differences in the lakes are controlled not by water temperature or salinity, but by sediment loading: the glacial meltwater holds large amounts of suspended sediment, which makes it denser than the less turbid water into which it flows.
In April 2017, the Arctic Monitoring and Assessment Program (AMAP) published a summary version of its forthcoming second Snow, Water, Ice and Permafrost in the Arctic (SWIPA) assessment, updating the first SWIPA report published in 2011. Representing contributions from more than 90 scientists, the new assessment details numerous ongoing trends in the Arctic climate and cryosphere: for example, Arctic air temperatures from 2011 to 2015 were warmer than at any time since instrumental records began around 1900; January 2016 was 5 degrees Celsius warmer than the average from 1981 to 2010; and both sea and land ice continue to substantially decrease in extent, thickness and duration. The report also lays out potential implications of these trends for Arctic and non-Arctic communities and ecosystems, as well as for industries and economies related to fishing, energy, minerals and other sectors. AMAP is a working group of the Arctic Council, an international body comprising representatives of eight Arctic states and six organizations of indigenous Arctic peoples.
© 2008-2021. All rights reserved. Any copying, redistribution or retransmission of any of the contents of this service without the expressed written permission of the American Geosciences Institute is expressly prohibited. Click here for all copyright requests.