
by Timothy Oleson Thursday, February 16, 2017
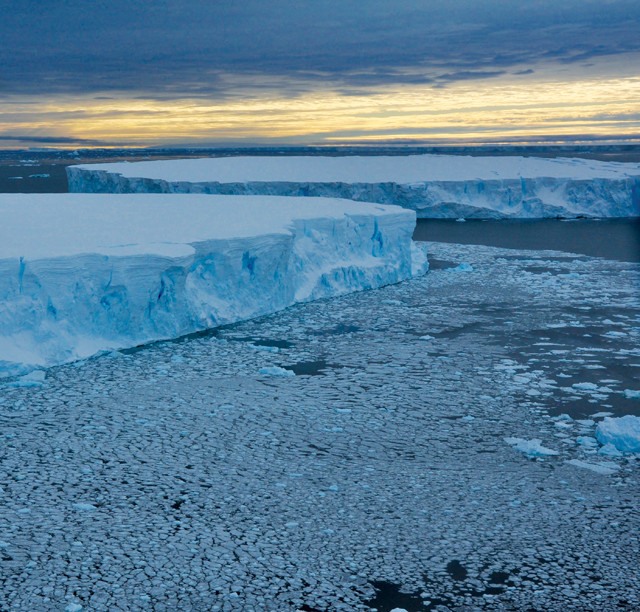
Large, tabular icebergs float in Pine Island Bay, part of the Amundsen Sea off the coast of West Antarctica. Credit: James Smith.
From Antarctica to the Arctic; from polar caps, permafrost and glaciers to ocean-rafted sea ice; and from burly bears to cold-loving microbes, fascinating science is found in every nook and crevasse of Earth’s cryosphere, and new findings are announced often. Here are a few of the latest updates.
Since satellite observations of the West Antarctic Ice Sheet (WAIS) became available in the early 1990s, scientists have documented continuous rapid retreat and thinning of the massive Pine Island Glacier (PIG), which drains roughly 10 percent of the WAIS into the Amundsen Sea. Calving of enormous icebergs in recent years, including one about eight times the size of Manhattan in 2013, has dramatically demonstrated the rapid loss of ice from the PIG. But when this modern episode of glacial retreat began has been unclear. Based on analysis of sediment cores collected from beneath the glacier’s floating ice shelf, James Smith of the British Antarctic Survey and colleagues reported in Nature that it likely dates back to about 1945, when the base of the PIG began retreating from a large seafloor ridge on which it had been grounded. A transition in the cores, from sand and gravel to muds containing the remains of open-ocean plankton, suggested that seawater started seeping past the ridge at this time, forming an ocean cavity beneath the ice shelf and facilitating melting of the shelf from below. The timing of the initial retreat from the ridge, which was completed by about 1970, correlated with an El Niño-associated period of warming in West Antarctica.
In another study of the PIG, researchers found evidence of a glacial calving mechanism not observed before in Antarctica: Rifting in a 2015 calving event that loosed a 588-square-kilometer iceberg “originated from the center of the ice shelf and propagated out to the margins,” noted Ian Howat of Ohio State University, co-author of the Geophysical Research Letters study, in a statement. “Rifts usually form at the margins of an ice shelf, where the ice is thin and subject to shearing that rips it apart,” he said. Based on analysis of Landsat 8 imagery, Howat and his colleagues found that the rift — first spotted in images taken in 2013 and occurring farther up-glacier than previously observed — had started at the base of the ice shelf before propagating upward and eventually reaching the surface. The most likely explanation for the rifting style, the researchers suggested, is the formation of crevasses in the base of the ice shelf caused by melting by warm ocean water.
The Greenland Ice Sheet releases roughly 1,000 cubic kilometers of freshwater each year in the form of icebergs and meltwater into fjords and ocean basins that surround the island. But little is known about the proportions of this volume that come directly from glaciers versus from melting icebergs as they float through fjords toward the open ocean. Parsing these contributions is important for understanding how Greenland meltwater affects circulation in fjords — which in turn impacts further melting and breakup of glacial termini, wrote Ellyn Enderlin of the University of Maine and her colleagues in a new study in Geophysical Research Letters. It is also important for refining global ocean and climate models, they noted. Tracking icebergs in Ilulissat and Sermilik fjords for months using satellite imagery, the team calculated ice volumes lost to melting before the icebergs exited the fjords. They found that 10 to 50 percent of iceberg melting occurs in the fjords — more than previously assumed — and that icebergs contribute more meltwater overall to fjords than glaciers do through most of the year. “Iceberg melting is huge, and so if you don’t take that into account you’re going to come up with some crazy high estimates for glacier melting that might not be representative,” Enderlin said in a statement.
NOAA released its annual Arctic Report Card in mid-December, citing evidence for continued warming across the Arctic in 2016. Among other observations, the report highlighted that average Arctic surface air temperatures for the year ending in September 2016 were “by far the highest since 1900”; that the summer minimum sea-ice extent was the second lowest since 1979, the year satellite record-keeping of the Arctic began (the sea-ice extent in November was the lowest on record for the month); and that the Greenland Ice Sheet saw the second-earliest onset of spring melting in 37 years.
© 2008-2021. All rights reserved. Any copying, redistribution or retransmission of any of the contents of this service without the expressed written permission of the American Geosciences Institute is expressly prohibited. Click here for all copyright requests.