
by Bethany Augliere Tuesday, November 15, 2016
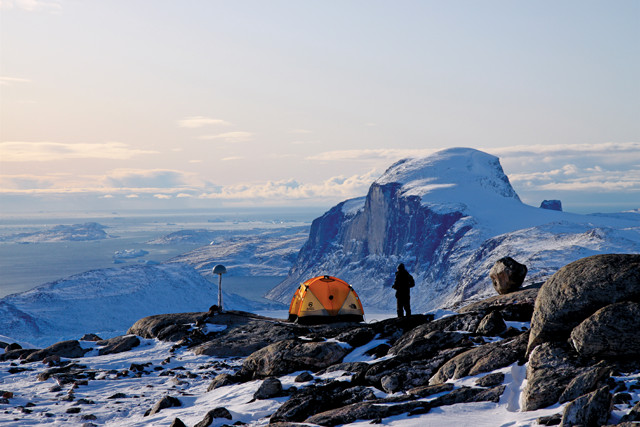
ASKY GPS station of the Greenland Global Positioning System Network. Research relying on this network shows the ground's movement on a regional scale. Credit: Michael Bevis.
From Antarctica to the Arctic; from polar caps, permafrost and glaciers to ocean-rafted sea ice; and from burly bears to cold-loving microbes, fascinating science is found in every nook and crevasse of Earth’s cryosphere, and new findings are announced often. Here are a few of the latest updates.
Antarctica may contribute more than a meter of sea-level rise by 2100, which is almost double previous estimates, according to new research in Nature. Robert DeConto, a climatologist at the University of Massachusetts Amherst, and David Pollard from Penn State, used models that incorporated previously ignored processes: hydrofracturing of buttressing ice shelves and the collapse of ice cliffs. This allowed them to recreate the high sea levels of the Pliocene, about 3 million years ago, and the last interglacial, about 150,000 to 130,000 years ago, both of which have perplexed modelers for decades. “That gave us the confidence to try to apply the model to the future,” DeConto says.
They applied three standard greenhouse gas emissions scenarios to the models ranging from low to high emissions. In the high-emissions scenario, where emissions continue unabated, Antarctica contributed up to a meter of sea-level rise in the next century. But there is good news, DeConto says. In the low-emissions scenario, which is in line with the 2016 Paris climate agreement to limit the rise in global temperature to less than 2 degrees Celsius, Antarctica contributes about 11 centimeters of sea-level rise. “The trajectory of future Antarctic atmospheric temperatures is a complex question, but this new modeling more tightly links the atmosphere with the ice-sheet dynamics,” DeConto says.
Greenland is melting 7.6 percent faster than previously thought, according to new research in Science Advances. Previous estimates of melt have come from the Gravity Recovery and Climate Experiment (GRACE) satellite, which records gravity anomalies from space and uses models to estimate mass change. But GRACE has an Achilles heel, says Michael Bevis, a geodesist at Ohio State University and a co-author of the study: “It cannot distinguish between ice, rock and water mass, it just measures mass change period.” So, GRACE’s model for rock mass change has been wrong, he says, “and that messed up the calculation of ice mass changes.”
The researchers used data from the Greenland Global Positioning System Network to obtain a direct measurement of the ground’s movement for the first time at a regional scale. They discovered that the reason the rock flow model was wrong has to do with a hot spot in the mantle that passed beneath the east margin of Greenland about 40 million years ago. GRACE models assumed average global viscosity of the rock, when in fact, mantle rock deep below Greenland is much more viscous because of this hot spot. This caused previous research to underestimate melting by about 20 gigatons. However, Bevis notes that although “this difference is not trivial, it’s not an enormous correction.”
What’s perhaps more interesting is that GRACE put the ice loss in the wrong places, Bevis says. When the team applied the models with the correct viscosity, they found that the ice has been lost primarily at marine terminating glaciers, a pattern that has prevailed for the last 100 years, according to prior research. And this is good news, he says, because it means the ice is behaving in a predictable way, which makes projecting into the future easier. Bevis notes that GRACE is still valuable, despite this flaw. “Every instrumental system has its strengths and weaknesses, when you combine these systems, the strength of one can compensate for the weakness of another,” Bevis says. “We have to start combining all of the instruments to make more accurate inferences, and not only look at the results of one particular technique.”
As of the end September, this year’s Arctic sea-ice extent was tied with 2007 as the lowest on record. As ice continues to decline, the Arctic will become more open for shipping routes, which has global economic implications, according to a new study in Geophysical Research Letters led by Nathanael Melia, a climate scientist at the University of Reading in England. To analyze the opening of these passages, Melia and co-authors ran five global climate models to project sea-ice extent over the next century. To calibrate the spatial extent of the sea ice, they used observations of sea-ice distribution and variability from the last 20 years. By about 2050, they project a twofold increase in the viability of these routes for standard open-water vessels. European routes to Asia, for example, could become approximately 10 days faster by midcentury via the Arctic routes.
“We were interested to see how the different choices that humanity makes in the future — in terms of greenhouse gas emissions — might affect these shipping opportunities,” Melia says. So the authors examined high- and low-greenhouse gas emissions scenarios. By the end of the century, they project that ships will be able to sail through the Arctic up to eight months a year in the high-emissions scenario, twice as long as under the low-emissions scenario. Ice-strengthened vessels could possibly travel year-round. One challenge, Melia notes, is that there will continue to be significant interannual variability in the timing and availability of these routes. The authors note that other factors will ultimately contribute to the usage of these routes, including the geopolitical climate and cost of oil.
© 2008-2021. All rights reserved. Any copying, redistribution or retransmission of any of the contents of this service without the expressed written permission of the American Geosciences Institute is expressly prohibited. Click here for all copyright requests.