
by Mary Caperton Morton Tuesday, March 29, 2016
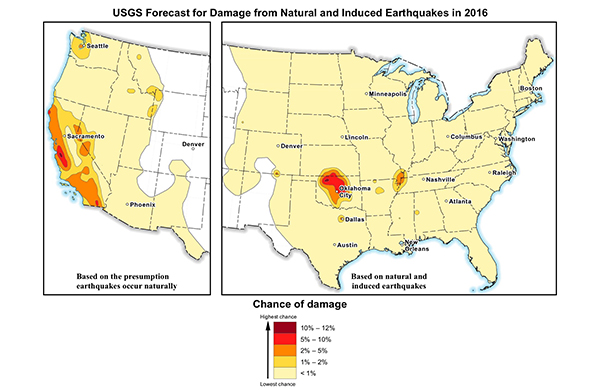
The U.S. Geological Survey released new seismic hazard maps Monday that, for the first time, factor in the ground-shaking hazard from human-induced seismicity. This map shows the forecast likelihoods that damaging shaking from a natural earthquake will occur in the western U.S. (left), or from a natural or induced earthquake in the central or eastern U.S. (right). Credit: U.S. Geological Survey
The U.S. Geological Survey (USGS) regularly releases National Seismic Hazard Maps that summarize hazards from potential ground shaking produced by faults around the country. This year, for the first time, those maps include not only natural earthquakes, but also earthquakes induced by human activities — particularly injection of wastewater produced during oil and gas extraction practices. The new maps were released Monday on the USGS website.
The incidence of induced quakes has increased dramatically since 2010, with the central U.S. experiencing more than 1,000 earthquakes above magnitude 3 in 2015, up from roughly 24 such quakes per year between 1973 and 2008. To date, the largest induced event was a magnitude-5.6 quake recorded in 2011 near Prague, Okla., which was linked to several active wastewater injection well sites nearby. On its own, hydraulic fracturing, or fracking — commonly used to help liberate gas and oil trapped in underground rock formations — is thought to only rarely trigger earthquakes above magnitude 3.
The 2014 National Seismic Hazard Maps did not consider induced earthquakes in its forecasts. The quakes’ inclusion in 2016 highlights the evolving understanding of induced quakes, as more detailed seismic data have allowed researchers to link earthquakes in time and space to fluid-injection practices, particularly in Oklahoma. “I don’t think there is any debate within the scientific community that wastewater injection causes earthquakes,” said Justin Rubinstein, deputy chief of the Induced Seismicity Project at USGS in Menlo Park, Calif., in a press conference on Monday.
Overall, inclusion of induced earthquakes in the new seismic hazard maps shows a significantly increased likelihood of damaging earthquakes occurring in parts of the central and eastern U.S., potentially affecting more than 7 million people in six states (Arkansas, Colorado, Kansas, New Mexico, Oklahoma and Texas). “In a few portions of the central and eastern U.S., the chance of damage from induced and natural earthquakes is similar to the hazard from natural earthquakes in high-hazard areas of California,” said Mark Petersen, chief of the USGS National Seismic Hazard Mapping Project, at the press conference.
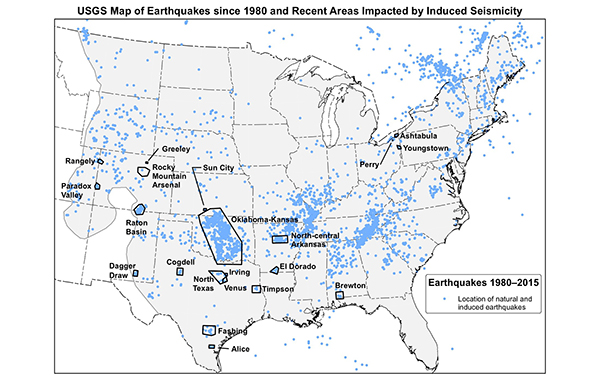
Blue dots on this map indicate the locations of natural and induced earthquakes of magnitude 2.5 or higher that occurred in the central and eastern U.S. between 1980 and 2015. Outlined areas indicate where scientists have observed rapid changes in seismicity associated with subsurface wastewater injection. Credit: U.S. Geological Survey
Despite scientists’ improved capabilities in identifying induced earthquakes based on their timing and location, distinguishing them from naturally triggered events still presents a challenge, Rubinstein said. “As far as we can tell, induced earthquakes are produced through the same slip process as natural earthquakes,” he said. “When we look at the seismograms, there’s nothing we’ve found to distinguish whether they were triggered naturally or induced. Obviously, this is a critical question and an area of very active research.”
A clearer picture will require better seismic data, “with more seismometers on the ground to record even the smallest events,” Rubinstein said. “And we need better data from industry, including injection volumes, injection pressures, and information about where they’re injecting and when.”
Access to industrial data is limited; the U.S. Environmental Protection Agency only requires that petroleum companies release their injection data on an annual basis. “For us to advance our scientific modeling, we really need more information, more often,” Rubinstein said. “Ideally, we’d like to get daily reports.”
Efforts to map the location and geometries of active faults near injection well sites have been more effective, with state geologic agencies working with USGS to produce updated fault maps. “These maps have been instrumental in linking earthquakes to active injection wells to the point that we are certain these induced earthquakes are directly related to the petroleum process,” Petersen said.
In addition to including induced seismicity for the first time, the new models also forecast the potential for ground shaking specifically in the calendar year 2016, the shortest time frame yet for a USGS seismic hazard map. The maps typically forecast shaking potential over 50-year periods. The shorter time frame reflects the tendency of induced earthquake activity to rapidly increase or decrease over time with wastewater injection activity. The map will need to be updated more frequently now that it includes induced quakes, especially as new regulations and restrictions concerning wastewater disposal come into play, Peterson said.
In parts of Oklahoma and Arkansas, new regulations and restrictions enacted in the last few years on wastewater injection practices have led to an immediate and sustained reduction in induced seismicity. “The data are still coming in … but it does seem that better regulation of fluid injection does lead to a decrease in seismicity in areas,” Rubinstein said.
© 2008-2021. All rights reserved. Any copying, redistribution or retransmission of any of the contents of this service without the expressed written permission of the American Geosciences Institute is expressly prohibited. Click here for all copyright requests.