
by Terri Cook Wednesday, December 30, 2015
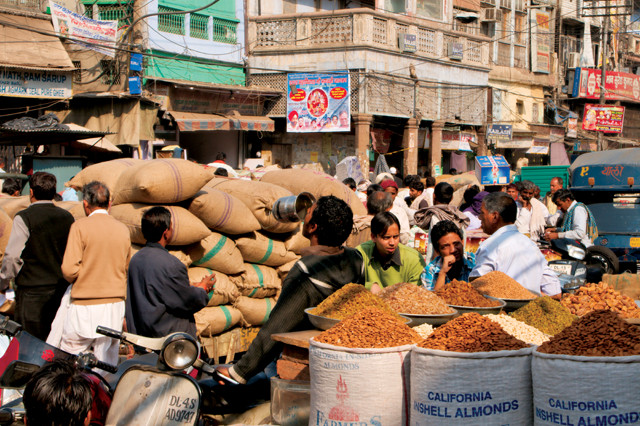
A market in Delhi, India. Credit: Christian Haugen, CC BY 2.0.
In April 2008, violent protests erupted across the impoverished Caribbean nation of Haiti. Enraged by soaring food prices and all-too-frequent hunger pangs, protesters smashed windows, looted shops, barricaded streets with blazing cars and stormed the presidential palace in the capital, Port-au-Prince. The week of violence, during which five people were killed, flared after the cost of staples like beans and cooking oil spiked dramatically and the price of rice nearly doubled in four months, increasing hardships in a nation where 80 percent of the population survives on less than $2 per day.
So-called “food riots” aren’t restricted to the Caribbean. Between 2006 and 2008, as the cost of food, fuel oil and other commodities surged to levels not experienced in almost three decades, disturbances erupted around the planet. Large — and frequently violent — protests broke out in Latin America, Asia, the Middle East and Africa.
Although many factors, like high unemployment, political frustration and poverty, contribute to social unrest, the timing of the 2007–2008 turbulence correlated clearly with peaks in global food prices. According to a study published in 2011 by the New England Complex Systems Institute, when the United Nations Food and Agriculture Organization’s (FAO) Food Price Index rose above 180, food riots occurred in 30 countries. When the index decreased later that year, social unrest also declined.
In the past, price spikes like these have usually been short-lived, wrote Joel Bourne Jr. in his 2015 book, “The End of Plenty.” Things typically evened out quickly as global trade shifted grain from countries with surpluses to those with deficits, and farmers responded to higher prices by increasing planting. But in 2007–2008, the world’s grain harvests were close to record-setting levels. Unlike in the past, Bourne wrote, this time the increased prices — and the ensuing violence — were due to the fact that the world was running out of food.
Feeding the world today is a daunting challenge; in the future, as global population skyrockets, it is likely to be a Herculean task. But researchers around the world are working on the problem, including how to implement the many changes that must happen locally at the farm level to effect large-scale change. But first, farmers need information. And that’s where science comes in.
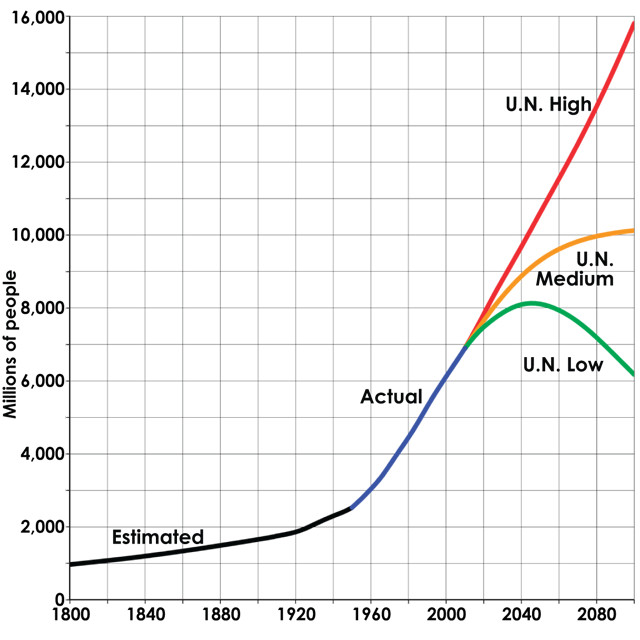
World population estimates from 1800 to 2100, based on high, medium and low United Nations projections in 2010 (red, orange and green), U.S. Census Bureau historical estimates (black), and recorded population figures as of 2010 (blue). Statistical analysis suggests an 80 percent chance that by 2100, the population will be between 9.6 billion and 12.3 billion people. Credit: Tga.D based on Aetheling's work, UN Data, CC BY-SA 3.0.
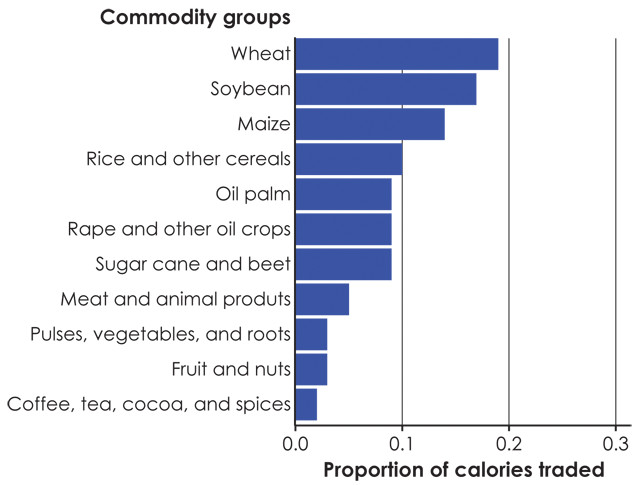
the bulk of agriculture worldwide, much agricultural production is still traded across international borders. This graph shows the breakdown of global agricultural trade in terms of calories — for example, wheat makes up 20 percent of the total calories that are traded internationally. The graph incorporates commodities from 139 different crops and 10 livestock animals, sorted into 11 commodity groupings. Credit: K. Cantner, AGI, after MacDonald et al., Bioscience, 2015.
Last summer, the planet’s population reached 7.3 billion. Of these, 795 million people lack enough food to lead healthy, active lifestyles, according to the United Nations World Food Program. In addition, more than 2 billion people currently suffer from “hidden hunger” — deficiencies in micronutrients such as iodine, vitamin A and iron — that can lead to blindness, stunted growth and restricted cognitive development.
The world’s population is projected to reach 8.5 billion by 2030, 9.7 billion by 2050 and 11 billion by 2100, according to the United Nations World Population Prospects report released last July. Unlike previous estimates, which generally agreed that the planet’s population would peak at 9 billion to 9.5 billion people in about 2070, a statistical analysis published in 2014 in Science concluded that the planet’s population is unlikely to stabilize this century. There is now an 80 percent chance, the authors reported, that, by 2100, the planet will host between 9.6 billion and 12.3 billion people.
These numbers add up to roughly 75 million more mouths to feed each year. Add to that the increasing demand for grain from livestock to feed increasingly meat- and dairy-rich diets, as well as from biofuels, particularly in the U.S. and Europe, and all told, the FAO estimates that by 2050, the global food demand will rise more than 60 percent above 2005 levels. Other estimates suggest that number may be as high as 110 percent, says Deepak Ray, a senior scientist at the University of Minnesota’s Institute on the Environment.
Rapidly increasing productivity is a big challenge, which will only be made more challenging by a changing climate that could bring increasing temperatures, changing precipitation patterns, rising water levels along coasts, and larger and more frequent extreme-weather events, according to a report issued last August by the joint U.S.-U.K. Taskforce on Extreme Weather and Global Food System Resilience.
A 2012 study by the Consultative Group for International Agricultural Research found the global food system contributes nearly one-third of anthropogenic greenhouse gas emissions. As a driving force behind climate change, it creates a vicious cycle that will be difficult to break. Compounding these issues is the fact that agricultural production also impacts the environment through loss of biodiversity, degradation of soils, and pollution and use of sparse freshwater resources. How we meet the planet’s growing demand for food, while simultaneously mitigating agriculture’s environmental impacts, will be one of the 21st century’s greatest challenges.
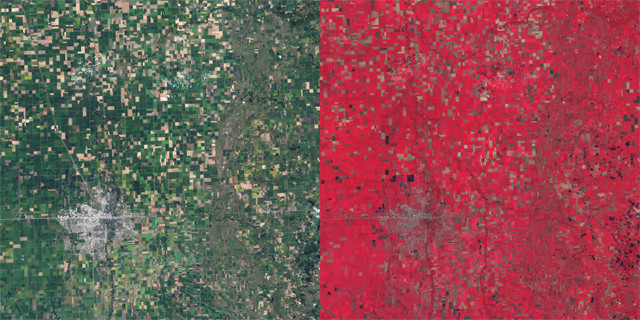
These Landsat images of farmland in northwestern Minnesota (true color at left and false color at right) in September 2009 show how fields change hues depending on crop conditions. The true-color image shows that most fields are doing well; brown squares are fields that either have been harvested already or are damaged. The false-color image provides further information: Farmers are trained to see yellows where crops are infested, shades of red indicating crop health, black where flooding occurs, and brown where unwanted pesticides land on chemical-free crops. Credit: both: NASA Earth Observatory, Jesse Allen.
Fortunately, the number of tools and technologies available to help humanity tackle this challenge is increasing. In 1999, Navin Ramankutty, now an agricultural geographer at the University of British Columbia in Vancouver, fused satellite data with census reports, creating the first realistic global maps of agriculture. Since then, Ray says, scientists and managers have had access to increasingly detailed geospatial datasets like global crop yields and harvest frequencies, and insights from these data have transformed the field. “They revolutionized agronomy,” he says.
Since the launch of the Landsat program in 1972, remote sensing has played an integral role in agricultural mapping and monitoring. And the rapid improvements in Earth observation technologies in recent decades have offered opportunities to boost agricultural productivity and address critical issues in the world food system.
One of the leaders in this realm is the Group on Earth Observations (GEO), a voluntary partnership of governments and international organizations working to integrate Earth observations into resources that can guide policy decisions. In 2011, the Group of Twenty Agriculture Ministers tasked GEO with using remote sensing tools to strengthen agricultural monitoring. The goal of the resulting GLobal Agricultural Monitoring initiative (GEOGLAM) is to improve the international community’s capacity to both generate and disseminate timely, accurate forecasts of agricultural production at regional to global scales.
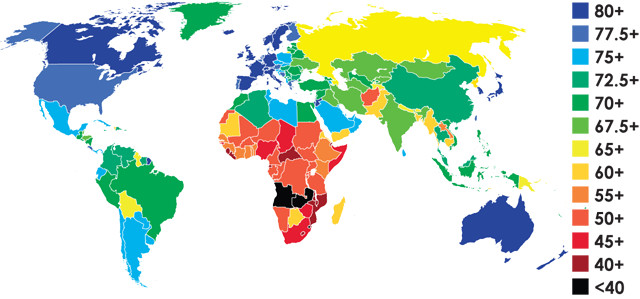
In 2012, the average global life expectancy was 70.5 years, according to the World Health Organization. This 2012 map shows average life expectancy by country. Increasing life expectancy adds to the number of mouths to feed. Credit: Fobos92, CC BY-SA 3.0.
One GEOGLAM partner is CropWatch, a program sponsored by the Chinese Academy of Sciences that relies heavily on remote sensing data to monitor global crop production. CropWatch issues quarterly bulletins that report global agroclimatic conditions as well as the status of major producers of maize, wheat, rice and soybeans — the “big four” crops that provide about 80 percent of all calories consumed by humans.
A 2013 review of CropWatch’s remote sensing products in the International Journal of Digital Earth found its estimates of crop conditions and acreage, and its predictions of crop yields and food production, to be highly accurate. Such data can offer early warnings of potential shortages so that timely interventions — such as the delivery of food aid — can be planned and implemented.
Ray and other researchers are also working on global production numbers. He and his colleagues have developed an extensive crop statistics database filled with satellite data that they use to analyze how crop yields are changing. Specifically, they’re interested in whether or not the world is on track to double global food production by 2050 to meet the projected demands without clearing additional land, which has widely acknowledged drawbacks due to greenhouse gas emissions and loss of biodiversity. How the productivity of the big four crops is increasing on existing agricultural land will determine whether we can meet these growing demands.
In a 2013 analysis in PLOS One, Ray and his team concluded that most recent yields of the four major crops are increasing at 0.9 to 1.6 percent per year — nowhere near the annual rate of 2.4 percent necessary to double production by 2050. At current rates, only about a 38 percent increase in wheat, a 42 percent increase in rice, a 55 percent increase in soybeans and a 67 percent increase in maize production will be possible by 2050.
The situation, Ray says, is that “most of the lands that could potentially be brought under crop cultivation have already been brought into production.”
If increasing crop yields and expanding the area under cultivation aren’t possible or desirable, a third strategy is to increase the frequency of harvests on existing croplands, wrote Ray and ecologist Jonathan Foley, now executive director of the California Academy of Sciences, in a 2013 study in Environmental Research Letters. This could be accomplished by planting multiple crops per year, reducing crop failure and leaving less land fallow.
By analyzing a global compilation of agricultural statistics, Ray and Foley uncovered significant differences in the frequency of cropland harvests in countries around the planet. Between 2000 and 2011, 19 countries in Europe, Latin America, Asia and Africa were statistically “unable to harvest their standing cropland even once every two years.” In other words, on average, farmers in these 19 nations failed to harvest even half of their crops each year. This was most likely due to crop failure caused by factors such as drought, lack of rainfall at the right times, catastrophic storms and pests. The researchers also identified a larger number of nations that are harvesting their croplands less than once, on average, per year, as well as numerous countries in the tropics which, despite the more favorable climate, are not meeting their potential of two or three harvests per year.
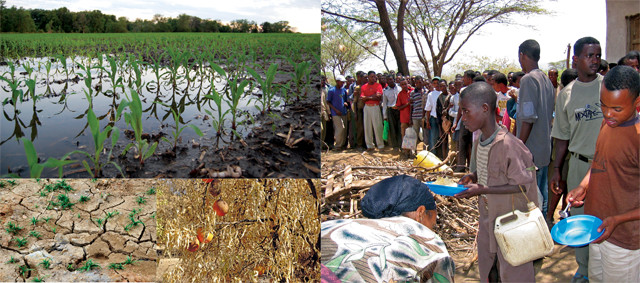
Satellite data can indicate months ahead of time if a crop is likely to fail due to drought, pests, floods or other hazards. Advance knowledge of food shortages allows for timely interventions, such as the delivery of food aid as shown above in Ethiopia. Credit: clockwise from top left: Sonya Green, CC BY 2.0; Tony Hall, CC BY-NC-ND 2.0; USDA photo by Cynthia Mendoza; Neil Palmer, CIAT, CC BY-SA 2.0.
By calculating the maximum potential number of harvests in each country and comparing this with what’s actually happening, Ray and Foley identified “harvest gaps.” Such gaps “show the potential to grow more food on the same piece of land if conditions become more suitable.” Africa has the largest concentration of harvest gaps, followed by Asia and Latin America. Closing these gaps could boost agricultural production by nearly 50 percent above 2010–2011 levels, at least over the short term, although the researchers warned that increasing the frequency of harvests could also lead to the “long-term deterioration of soil, water resources and the agricultural land base.” Closing the gaps in a sustainable way may not be easy, Ray says, given that modern industrial-scale agriculture currently relies heavily on the use of chemical fertilizers and pesticides.
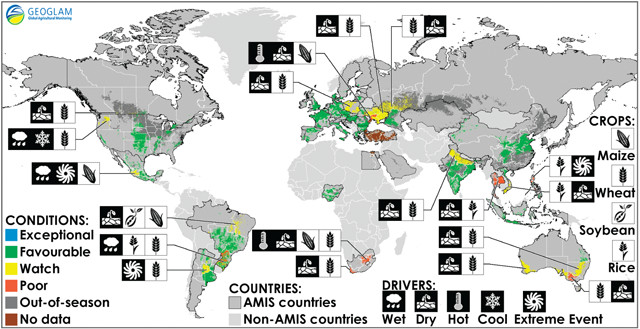
This GEOGLAM map from August 2015 shows crop conditions over the main growing areas for wheat, maize, rice and soybeans. Areas with crops that are in less than favorable condition are displayed on the map with the specific crops affected and the key climatic drivers affecting crop conditions. Credit: GEOGLAM, geoglam-crop-monitor.org.
Scientists aren’t just modeling current production, but also how future agricultural production might be affected by the effects of a changing climate — increasing temperatures, variations in precipitation patterns, rising carbon dioxide concentrations, and increasing air pollution.
In 2009, NASA researchers Chris Funk and Molly Brown modeled the convergence of three trends — changes in climate, changes in agricultural production and population increases — and used the results to simulate the impacts on global cereal availability through 2030. The researchers concluded that by that time, global per capita cereal production will be about 327 kilograms, down from a peak of 372 kilograms in 1986. The projected decrease in per capita production could re-expose millions of people in Asia to chronic undernourishment. Even harder hit, however, would be eastern and central Africa, with their rapidly increasing populations and already low per capita cereal production levels. Without a “concerted effort,” the researchers noted, international food security will continue to erode, and much of the planet “will experience significant reductions in food availability as consumption demands increase.”
In a warming world, modeling efforts like this provide critical input for formulating new regulations and policies at regional, national and international levels. Germany, for example, implemented a series of climate laws in 2007, one of which was an ordinance that ensures sustainability standards for biofuel production. The United Nations, meanwhile, suggests that changing regulations for mitigating pollution from ozone — whose formation strongly correlates with temperature — is an important strategy for safeguarding food production.
To understand how ozone affects the production of the planet’s major crops, a team led by Amos Tai, now an associate professor at the Chinese University of Hong Kong, modeled the individual and combined effects of mean temperature and ozone pollution trends from 2000 to 2050 on the production of the four major crops.
In a 2014 Nature Climate Change study, the researchers estimated that the combined effects could reduce global crop production by more than 10 percent by 2050. They also found that wheat and rice production is generally more sensitive to ozone than maize or soybeans. Depending upon the modeled pollution scenario, the study predicts declines in wheat production of 50 to 60 percent by 2050 in southern Asia, and rice production decreases of up to 5 percent in both southern Asia and China.
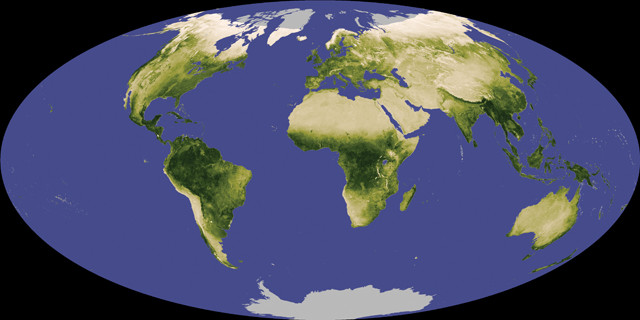
Scientists use the Normalized Difference Vegetation Index, shown here from Nov. 1, 2007, to Dec. 1, 2007, to monitor how green different parts of the planet are and to assess how that greenness changes over time due to drought, floods, pests or other influences. Credit: NASA images produced by Reto Stockli and Jesse Allen, using data provided by the MODIS Land Science Team.
Much work also needs to be done to understand the uncertainties inherent in models used to assess environmental and economic impacts, wrote John Ingram and co-authors in their 2010 book, “Food Security and Global Environmental Change.” “A major limitation of most models,” they wrote, “is that they may address only individual components of the food system and thus are unable to analyze the interactive effects and feedbacks among components.”
To make modeling assessments more reliable, a major interdisciplinary initiative, Agricultural Model Intercomparison and Improvement Project, led by Cynthia Rosenzweig, a senior research scientist at the NASA Goddard Institute for Space Studies in New York, is working to improve projections of the impacts of climate change on the agricultural sector, with the goal of increasing the ability of all nations to adapt to this change, the researchers say.
The project has organized teams of scientists to improve predictions of agricultural productivity in response to such factors as high temperatures, elevated carbon dioxide concentrations, and limited water resources. Similar teams, organized by model type, crop type and region, are working to improve and integrate environmental and food system models to better understand the relative importance of each of these factors.
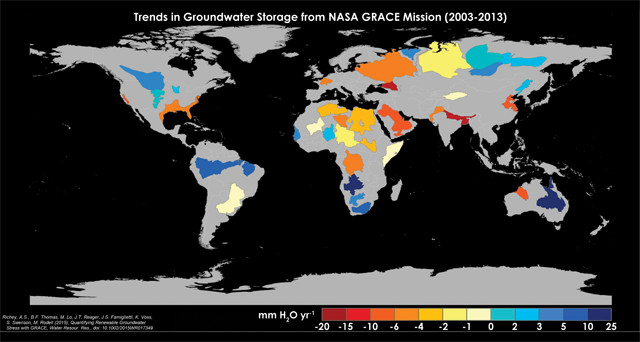
Twenty-one of Earth's 37 largest aquifers have exceeded sustainability tipping points and are being depleted, with 13 considered significantly distressed. This situation threatens regional water security and resilience, according to a study using NASA GRACE data from 2003 to 2013. Credit: UC Irvine/NASA/JPL-Caltech.
Water is certainly going to be a limiting factor — if not the limiting factor — for feeding 11 billion people. Until recently, agricultural paradigms have focused primarily on improving agricultural production, often to the detriment of the environment, wrote a team led by Foley in a 2011 Nature paper. Unsustainable water withdrawals, particularly in regions with competing water demands, are one of many factors affecting food security, especially given that at least half of the irrigation water used to grow the world’s food is supplied by groundwater, wrote Jay Famiglietti, a professor of earth systems science and civil and environmental engineering at the University of California at Irvine, in a 2014 Nature Climate Change commentary.
Around the planet, groundwater is being extracted at much greater rates than it’s being naturally replenished, and many of the world’s largest aquifers — almost all of which underlie and are largely responsible for enormously productive agricultural regions — are being unsustainably pumped. To meet the planet’s growing demand for food, groundwater needs to be more carefully managed, especially in crucial agricultural areas, Famiglietti wrote.
In recent years, NASA’s Gravity Recovery and Climate Experiment (GRACE) has become a critical tool for monitoring agricultural groundwater withdrawals. The mission’s twin satellites make detailed measurements of Earth’s gravity field, which allow scientists to calculate changes in the mass of terrestrial water storage, including groundwater, soil moisture and snow, at regional to continental scales. GRACE is providing unprecedented data about groundwater depletion, which are helping scientists anticipate future food security issues around the planet.
In northwestern India, for example, there has been indirect evidence for years of severe groundwater depletion in the “breadbasket” states of Haryana, Punjab and Rajasthan. In 2009, a group of scientists, led by Matthew Rodell, chief of the Hydrological Sciences Laboratory at NASA Goddard Space Flight Center, used GRACE data to confirm that groundwater in the region was being extracted at an average rate of almost 18 cubic kilometers per year from 2002 through 2008. In certain parts of Haryana, local rates of water table decline are as high as 10 meters per year, the researchers reported in Nature.
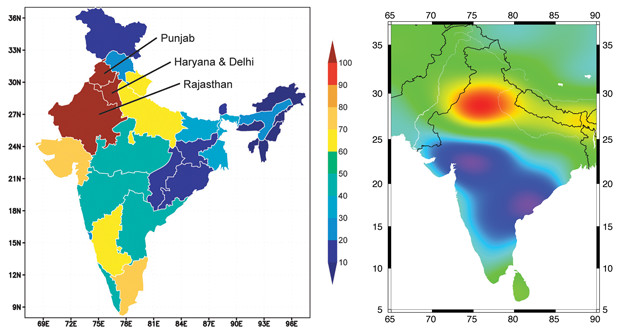
Left: Groundwater withdrawals as a percentage of groundwater recharge, based on state-level estimates of annual withdrawals and recharge reported by India's Ministry of Water Resources. Below: Groundwater volume changes in India from 2002 to 2008, with losses in red and gains in blue, based on NASA GRACE satellite observations. In the "breadbasket" states of northwestern India during this period, groundwater was being extracted at an average rate of almost 18 cubic kilometers per year. Increases in groundwater in southern India are due to above-average rainfall; rainfall in northwestern India was about normal during the study period. Credit: left: NASA/Matt Rodell; below: I. Velicogna/UC Irvine.
If measures aren’t taken soon to ensure the sustainable use of groundwater in that region, Rodell and his colleagues wrote, the consequences may include shortages of potable water, a reduction of agricultural output and severe socioeconomic stresses. In addition, they noted, competition for limited water resources with neighboring Pakistan, where groundwater is essential for much of the arid nation’s agricultural output, is likely to aggravate the already-tense relations between the two countries.
Gathering tremendous amounts of global-scale data with advanced agricultural monitoring tools is vital, but farming is still a local endeavor. Somehow, all of that information has to be transferred down to the local farmer, who must be able to use it.
Lack of access to information that affects farming practices, such as temperature highs and lows and precipitation records, has historically made it difficult for “smallholder” farmers — family farmers who manage 1 to 10 hectares of land — to make informed decisions regarding how much of which crops they should plant, and when. This is particularly true in sub-Saharan Africa and Asia, where smallholders provide up to 80 percent of local food supplies, according to the FAO. There are an estimated half-billion smallholder farms on the planet.
The recent advent of open data practices, which allow users with Internet access to pull, process and share information from multiple sources, could enable faster and more effective decision-making by on-the-ground smallholders, fostering innovation and offering transparency, according to a 2015 report by the Global Open Data for Agriculture and Nutrition initiative.
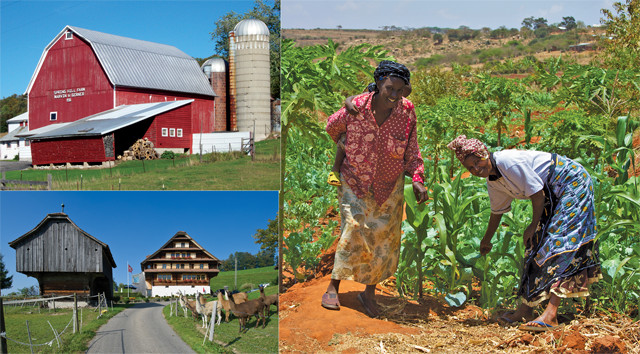
About 500 million farms across the world — from Wisconsin to Switzerland to Kenya — are so-called smallholder farms: family farmers managing 1 to 10 hectares of land. Credit: left to right: Royalbroil, CC BY-SA 2.5; Leiju, CC BY-SA 3.0; McKay Savage, CC BY 2.0.
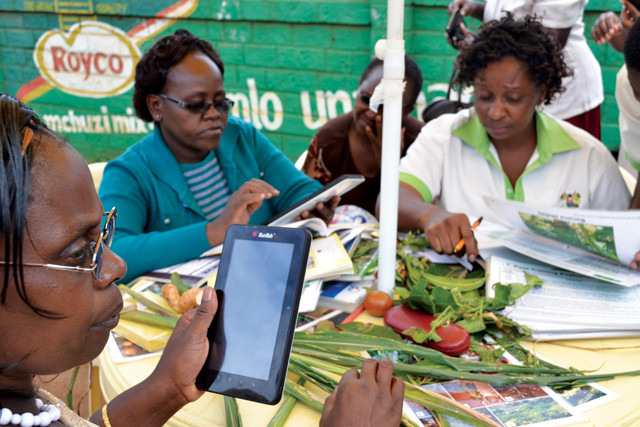
Plantwise is a program that aims to reduce pest- and disease-induced crop losses by putting technology and big data in the hands of smallholder farmers, such as these in Kenya, to help them diagnose what is harming their crops and prevent crop losses. Credit: Center for Agriculture and Biosciences International.
Open data are increasingly being used to underpin mobile phone apps for farmers, who can use them to access critical agricultural information in a timely manner. One example is Plantwise, a program led by the nonprofit Center for Agriculture and Biosciences International that aims to reduce pest- and disease-induced crop losses, which can be as high as 40 percent per year globally. By combining open-access data from a variety of sources into easy-to-search formats, Plantwise has developed a series of tools that help farmers diagnose what is harming their crop, alert them to pest outbreaks and provide access to more than 9,000 fact sheets with information on best practices to prevent crop losses. Within a couple of years, Plantwise has helped more than 2 million smallholder farmers in 33 developing countries.
Another effort using data analysis to help farmers in Colombia pinpointed the reasons for a 17 percent drop in rice yields from 2007 to 2012. After analyzing large datasets from both open and private sources, the nonprofit International Center for Tropical Agriculture (CIAT) helped develop a free agricultural decision-making tool for Colombian rice growers. When their analyses forecast a period of drought, CIAT offered planting advice to any farmer accessing the data, helping the farmers avoid an estimated $3.6 million in potential losses, according to a 2015 report by the Overseas Development Institute. The program is now being expanded to include rice growers in Peru and Nicaragua.
In Central and South America, Africa, India and other regions, billions of people are facing a future of food insecurity and the social unrest that could accompany it. Fortunately, a growing number of tools and technologies have the potential to provide tangible local benefits that will cumulatively allow us to confront these challenges. Increasing crop yields, slight shifts in diet and reductions in food loss and waste can collectively free up enough food to meet most demands, Ray says, although he emphasizes that there are no easy answers. The critical question, he says, is whether we can make these changes faster than the world’s hungry population grows.
© 2008-2021. All rights reserved. Any copying, redistribution or retransmission of any of the contents of this service without the expressed written permission of the American Geosciences Institute is expressly prohibited. Click here for all copyright requests.