
by Irina Overeem Friday, February 9, 2018
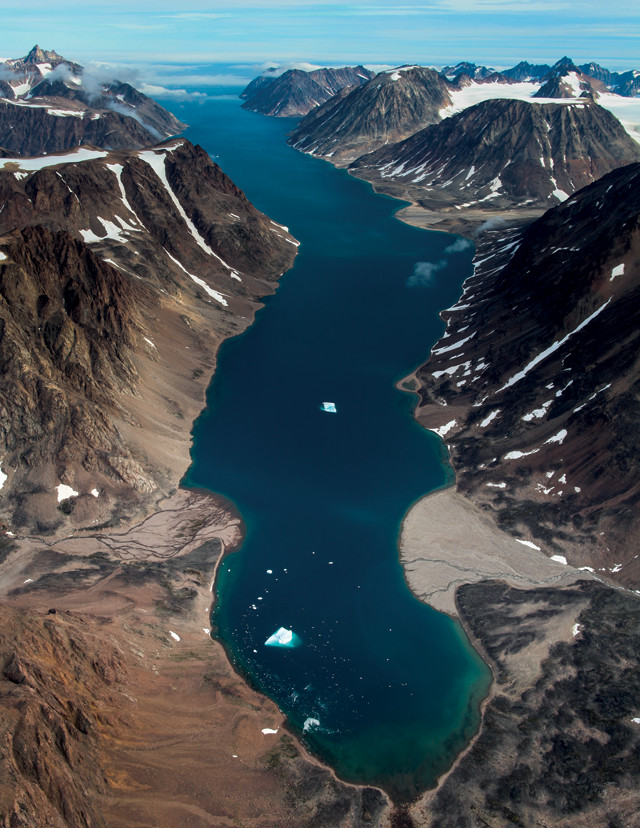
The coast of Greenland has more than 100 pristine deltas formed by rivers draining from the Greenland Ice Sheet into the sea, interspersed amid the coast's irregular geometry of fjords and icy bays. Credit: Anders Anker Bjørk.
Enormous quantities of fine sediment, sand and rock are carried downstream by rivers flowing off the Greenland Ice Sheet. Where these rivers meet the ocean, they deposit the sandy, coarse part of their sediment loads, forming textbook fan-shaped deltas. Credit: Nicolaj Krog Larsen.
Greenland’s rivers are impressive, with fast, powerful flows of turbulent, milky waters descending from glaciers of the Greenland Ice Sheet, which loom only a few kilometers upstream. Enormous quantities of fine sediment known as “glacier flour,” as well as sand and rock are discharged into and carried downstream by these rivers. The grinding action of the sediment-laden torrents is formidable and carves beautiful smooth sculptures in the solid granite bedrock. From the riverbank, the noise is overwhelming as the loud crashing of the turbulent water flow combines with a rumbling undertone from rocks colliding with the river bottom.
Farther downstream, the river flow spreads into many strands of shallow, swift channels, forming braided plains. These rivers end, often just a few kilometers downstream, where the flow meets the ocean, loses its momentum and deposits its sediment load, forming textbook fan-shaped deltas. The coast of Greenland has more than 100 pristine deltas draining into the sea, interspersed amid the coast’s irregular geometry of fjords and icy bays. The surrounding ocean waters are known by local Greenlanders as excellent fishing grounds, possibly because the sediments deliver nutrients to the fjord ecosystem, and the many small settlements dotting the rocky coast depend on this food source.
“, for example, more than 30 percent of the ice sheet’s surface was melting — far above historic rates. But how much meltwater drains off the ice sheet through rivers? And how are changes in those flows impacting the coastline and the sand-rich deltas? These were the questions on my mind as my team flew into some of these small coastal settlements, from which we would charter boats to ferry up the fjords to study the deltas.
For the past six summers, small field teams of graduate students from the University of Colorado Boulder (CU) and I have headed to West Greenland to collect field observations. I had hypothesized that Greenland’s rivers and deltas would be indicators of ice-sheet melt, since rivers should be the main conveyor of meltwater, and that deltas would trap glacially eroded sediments. To survey river mouths and deltas, we deployed oceanographic equipment to measure channel depth, salinity, sediment concentration and turbidity of the water.
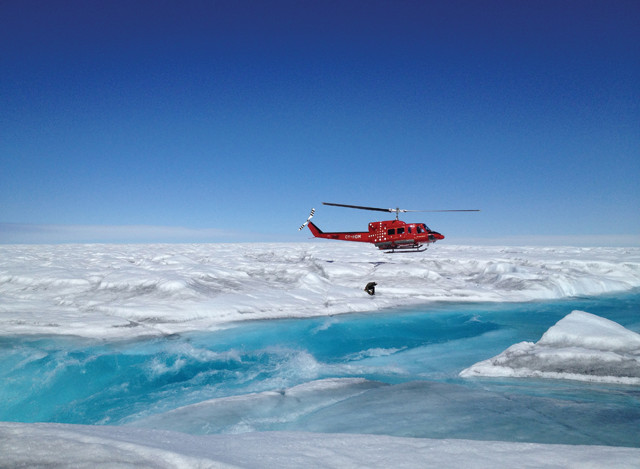
In summer, large rivers of meltwater form, even on the Greenland Ice Sheet, and drain water to the coast. Credit: UCLA.
“From these measurements, we’ve learned much more about the amount of meltwater draining off the Greenland Ice Sheet through rivers, and about how water and sediment transport there are changing. One of the biggest surprises — which emerged both from our measurements and from exploration of a unique dataset uncovered thanks to a visiting Danish researcher and an 80-year-old archive — was that the deltas are advancing despite rising seas. This stands in contrast to most other deltas around the world, which are losing ground. The cause seems to have everything to do with ice-sheet melt.
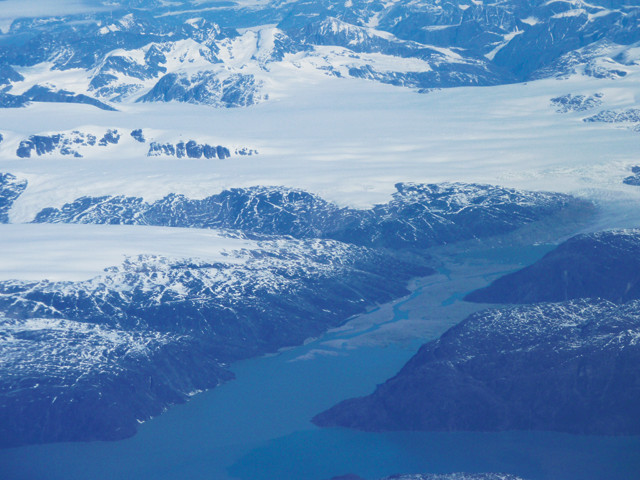
According to new research by Danish and University of Colorado scientists, increased melt off the Greenland Ice Sheet seems to be the most important control on the growth of deltas around Greenland. Credit: Irina Overeem.
“Greenlanders are very aware that river mouths are dynamic dumping grounds of sediment. During our fieldwork expeditions, our local ship captains routinely cautioned against going too close to the river mouths, fearing their boats may ground on newly formed shallow bars. Michael Rosing, a Greenlandic captain with whom we have worked many times over several years of collecting field observations in one particular river delta, warned us recently that there used to be a consistently deeper channel, but that now there seems to be no way of knowing which river channel is deep enough. He keeps a close eye on his depth sensor when approaching any delta edge.
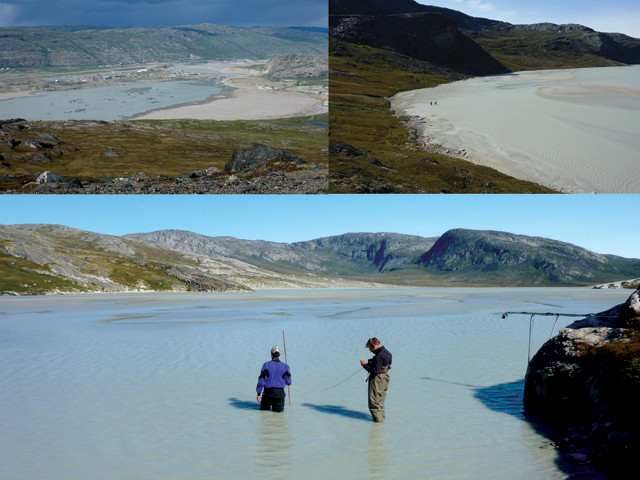
Top: The Kangerlussuaq Delta near Greenland's international airport is advancing. Middle and bottom: CU scientists Ben Hudson and Aaron Zettler-Mann take depth measurements in a river channel in a prograding delta near Pakitsjup, Greenland. Credit: all: Irina Overeem.
For our field team, these changes mean that we are dropped off at a safe spot more than 12 kilometers away from the shallow delta, and then hike through mosquito-infested tundra and grabby willow bushes for two days with all of our heavy scientific equipment and river samples. Twelve kilometers may be a walk in the park when you are on a trail, but the terrain in Greenland is challenging, with only winding caribou trails to follow to many dead ends — usually trampled vegetation where we would catch a whiff of hay and fur and some rancidness, probably a den. The hike was a real struggle the first year, when we had to install river-depth sensors, which get their energy from solar panels linked to heavy backup batteries. But even when we revisit the sites in later years, enough sample bottles, spare parts, repair tools and laptops — in addition to our own camping gear and food — have to be slogged in so that it requires us to make back-and-forth trips. Luckily, our spirits are buoyed by the stunning views of the ice sheet in the distance, the curious snow hare, grouse, foxes and caribou, and the excitement of collecting new data.
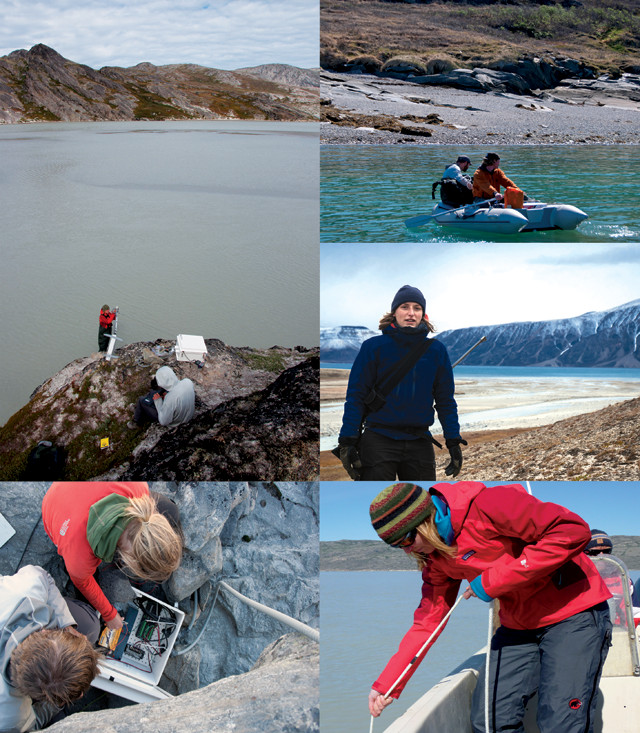
Danish and University of Colorado scientists, including the author (in red) and Mette Bendixen (in blue), install river-gaging equipment and conduct other fieldwork to study Greenland deltas. Credit: above: Ursula Rick; rest: Katy Barnhart.
“The size and shape of any delta — its morphology — is controlled by the balance between upstream source-area processes that supply sediment, and downstream marine processes, like wave and tidal action, that redistribute and export that sediment. If any of the controlling factors change, we expect delta morphology to change over time as well.
These controlling factors are indeed changing: Across the entire Arctic, including Greenland, climate has been warming over the last few decades. The 10 warmest years on record for the Arctic, for example, all occurred within the past 12 years, and 2016 was, by far, the warmest on record since 1900.
Along much of the Arctic Coast, warming has led to decreased ice extents and shorter sea-ice seasons. Last year, Arctic sea ice reached its annual minimum extent on Sept. 13, when it covered just 4.64 million square kilometers — a 25 percent reduction from the 1981–2010 average of 6.22 million square kilometers. This reduction is part of a long-term decline that has amounted to losses of 13 percent of sea-ice coverage per decade since satellite observations began nearly 40 years ago. As long as sea ice is present, there is hardly any coastal erosion, but as soon as the sea ice retreats, waves attack sandy coasts and rework sediments at the delta front. My own prior researchwith my CU Institute of Arctic and Alpine Research (INSTAAR) colleague Katy Barnhart has shown that Arctic coastal erosion rates are largely controlled by the duration over which the coast is exposed to open water.
A growing delta at Kangerlussuaq. Credit: Irina Overeem.
We could thus hypothesize that an increased period of exposure to waves would negatively impact Greenlandic deltas. What remained unknown was how the increased sediment that we hypothesized would arise from increased outflow from the melting ice sheet would also affect the deltas. We collaborated with modelers in the Netherlands and Belgium, who used detailed daily weather data from the Greenland Ice Sheet dating back 70 years, including measurements of atmospheric pressure, temperature, precipitation and wind, to analyze past annual cycles of snow accumulation followed by snow and ice melt and runoff. The numerical models show that melt was fairly stable until the 1980s, but that it has been rapidly accelerating over the last 30 years, in agreement with satellite sea-ice observations. Much of this meltwater is thought to drain into Greenland’s rivers and increase their transport capacity, delivering more water and sediment to the deltas. Unfortunately, only a few rivers along the Greenland coast have streamgages, and those have only been in operation for at the most 10 years, so we could not demonstrate this long-term trend from direct river measurements. Instead, we turned to the deltas themselves, reporting our findings in a Nature paper last year.
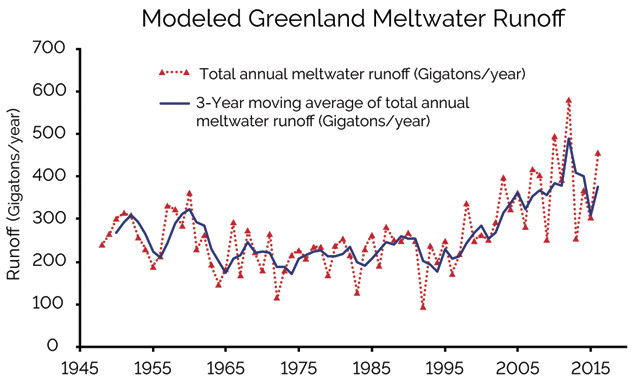
A numerical model shows a dramatic increase in Greenland's meltwater over the period covered by the aerial photos. Credit: K. Cantner, AGI, with data from Xavier Fettweiss, University of Liege, Belgium.
In 2016, Mette Bendixen, a graduate student at the University of Copenhagen in Denmark, visited INSTAAR for a few months to look into the question of what the deltas can tell us about the processes dominating changes along the Greenland coast. Bendixen had a fascinating dataset to explore.
A few years ago, Danish researchers found a tattered logbook from a Danish Air Force float plane containing surveys over the Greenland coast in the 1930s. The recovered logbook describes details of the mechanics of the plane, and lays out details of survey lines. The logbook also led researchers to an old bunker outside of Copenhagen, where they discovered tin boxes with perfectly preserved photo negatives from topographic surveys flown in the summer months from 1930 to 1938. In the 1930s, Denmark and Norway both claimed control of East Greenland, and these surveys were an effort by Denmark to show they were serious about their claim to sovereignty. Greenland’s coast is so vast and the summer season so short that land-based surveying progressed very slowly in the early 20th century. Pioneering efforts to develop aerial photo mapping techniques allowed for better mapping of Greenland’s coast.
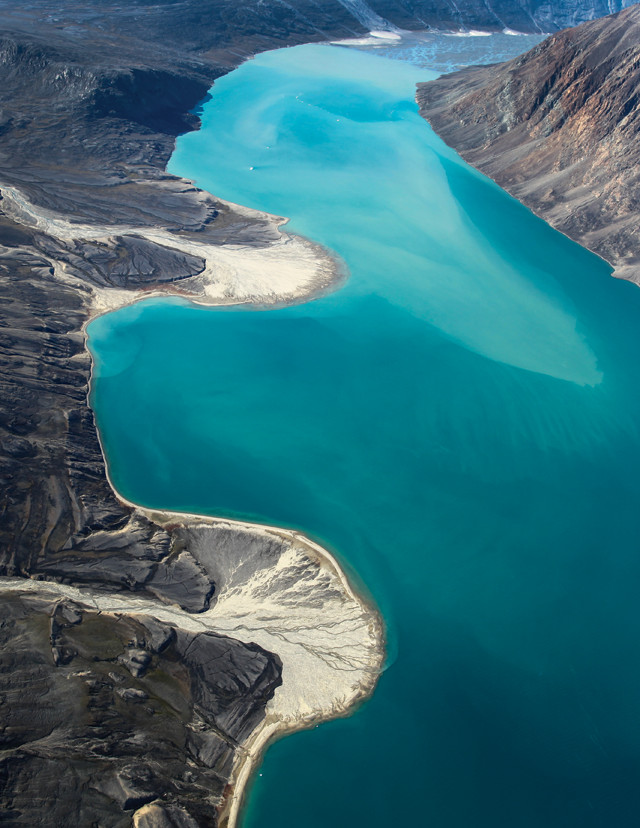
Glacial flour — suspended fine sediment — produces the incredible colors of the waters of many glacial rivers and the fjords into which they flow. Credit: Anders Anker Bjørk.
The Danish Air Force, in collaboration with scientists based on a sailboat in the fjords of Greenland, used float planes with an open cockpit that seated a pilot and radio operator in the front, and a photographer in the back, who operated a camera mounted on a swivel on the bottom of the plane. Expedition photographs show the crew dressed in furry white “polar bear” suits, worn to cope with the very cold temperatures at high altitude above the ice cap and glaciated coast. Ideally, air photos for stereo mapping are taken straight down. However, at the time, the planes could only fly at altitudes up to approximately 4,300 meters, and Greenland’s coastal mountains reach heights of 3,700 meters, so it was decided that sets of overlapping oblique photos were the next best way of capturing the topography. A second, more intensive aerial mapping campaign was flown in the 1940s during World War II by the U.S. Air Force. The U.S. consigned the imagery to Denmark after the war, and it was archived.
“All of the imagery is still stored in the basement of the Danish Geodata Agency, which holds almost 200,000 photos, with about 10,000 photos from the earliest expeditions in the 1930s,” Bendixen says of the archive. “To use these photos, you first have to search through the many shelves to find the right folder, release the tight leather straps, and turn over photo after photo before finding the exact one you want to use. Then, you scan it using a special scanner at very high resolution to digitize the photo. It is extremely time-consuming, but the information the photos hold is invaluable.”
Careful mapping was needed to “georeference” images from the archive — to merge them into a common coordinate system — so that each could be quantitatively compared to later air photos from the 1980s as well as much more recent satellite imagery. This georeferencing was employed for the vast majority of deltas along more than 3,000 kilometers of the island’s coastline stretching from 70 degrees north latitude in West Greenland to 60 degrees north in East Greenland. After processing all of the imagery, we then analyzed morphological changes at 75 Greenlandic deltas by using the historical aerial imagery from the 1930s and 1940s, aerial photos from the 1980s, and modern satellite data collected up to 2016. The areal extents of the selected deltas were quantified in each of these time periods, and changes were determined for two selected periods: 1940s to 1980s, and 1980s to 2010s.
“We found limited changes in the surface areas of deltas from the 1940s to the 1980s, while significant progradation — the buildup and extension of the delta front into the sea — occurred from the 1980s through the 2010s. Southern Greenland and the region around Greenland’s capital, Nuuk, in West Greenland, show the most pronounced changes in delta sizes. A fjord just south of Nuuk features an especially active river, and its delta expanded seaward by more than 5 kilometers, filling the entire width of the fjord. Deltas in the area around Kangerlussuaq, an inland town in West Greenland that was founded as a U.S. airbase in 1941, have also prograded. Even the location of the main harbor near Kangerlussuaq, which is used by supply ships and tourist cruise boats, has experienced siltation, due to an increase in the amount of silt suspended in the water column that deposited on the harbor floor. Interestingly, only a single delta prograded in the eastern region of Greenland.
After we mapped the morphological changes the deltas experienced over the years, we wanted to explore the quantitative relationships between these changes and the processes that are potentially controlling them. To disentangle these relationships, we used a statistical technique to test delta responses to various proposed causes. The statistical model formalized our hypothesis that warming, runoff and sea ice were all important possible controls on deltas, and also added additional relationships involving the rate of regional uplift to test whether we were including all processes.
“Then our team compiled data on the hypothesized controls for each delta system, like local temperature change over the decades and meltwater runoff changes from the numerical model, along with uplift rates and sea-ice changes from satellite records.
The statistical method confirmed that the most important control on delta progradation rates is the increased melt of the Greenland Ice Sheet. This explains why the West Greenland deltas grew much faster, as this is a known region of rapid ice-sheet melt. Locally, air temperature is the overarching factor, because rapid warming correlates to both increased meltwater runoff and longer open-water duration, resulting in delta progradation.
Surprisingly, we found that an increase in open-water duration weakly correlated with increased progradation. This is counterintuitive: We expected that a longer season of wave reworking, in the absence of sea ice, would enhance sediment transport away from the deltas. But if sediment were transported away by waves, the delta fronts would not be expanding. The reason for the correlation is not yet clear, but one possible explanation is that while trends in the satellite sea-ice record match the regional warming trends, the resolution of these data is too coarse (the cells in the sea-ice dataset are 25 by 25 kilometers, whereas the fjords are typically only 2 to 4 kilometers wide) to precisely capture what has happened at every protected delta. In other words, the low-resolution dataset only shows the sea-ice trends in the outer bays and the nearby ocean and may not be representative of the small-scale dynamics of sea ice within the fjords. It is clear, however, that the sediment transported with ever-increasing meltwater runoff is now the dominant force shaping Greenland’s deltas. It is difficult not to contemplate the fate of East Greenland deltas that are still relatively stable: As ice-sheet melt expands in the eastern region, we expect those delta systems to begin actively prograding as well.
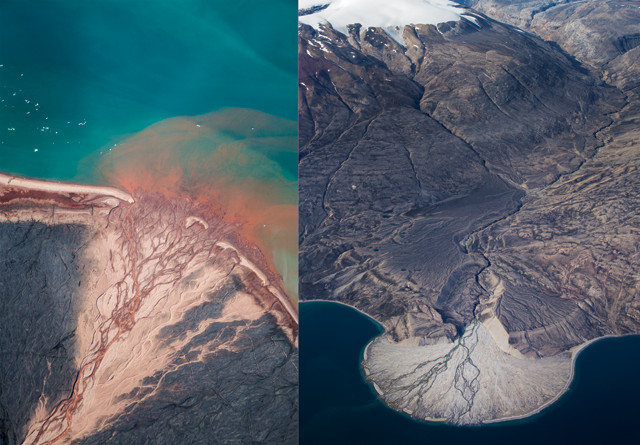
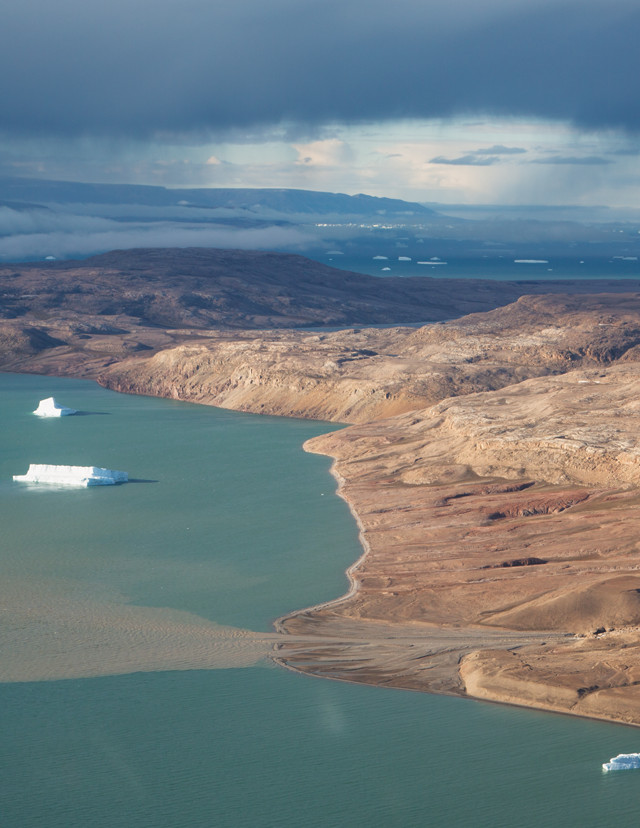
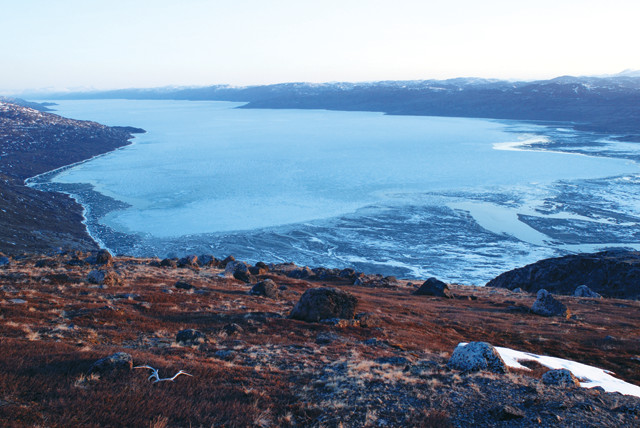
The CU team's research showed that deltas are advancing throughout Greenland, the only place in the world where that is routinely occurring; elsewhere, deltas are drowning due to subsidence and global sea-level rise. Credit: both: Nicolaj Krog Larsen.
Greenland’s deltas may be unique in the world. As most of the world’s temperate deltas are drowning from subsidence and sea-level rise, Greenland’s deltas are advancing. These Arctic deltas offer decadal-scale records of ice-sheet melt, and while we do not have direct measurements of increasing proglacial river water and sediment discharge, real-world delta progradation patterns confirm ice-sheet melt rates that previously only had been inferred from computer models. These computer models are the main tools that scientists use to project scenarios of future ice-sheet melt and to make associated projections of sea-level rise — which is why Greenland’s melt is of relevance to all coastal regions in world. It is encouraging that we can now independently verify the validity of Greenland Ice Sheet modeling — even if the results don’t look so good for coastal regions.
This summer, we’ll again don our mosquito hoods and trek into the tundra, laden with equipment, to see what more we can learn about these ever-changing systems.
© 2008-2021. All rights reserved. Any copying, redistribution or retransmission of any of the contents of this service without the expressed written permission of the American Geosciences Institute is expressly prohibited. Click here for all copyright requests.