
by Mary Caperton Morton Thursday, March 8, 2018
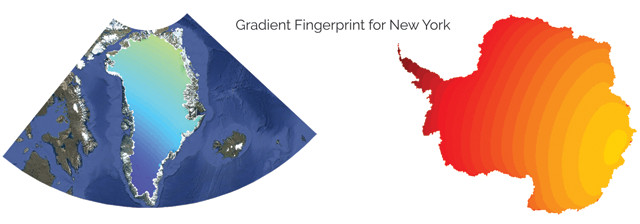
Gradient fingerprint mapping can be used to determine how the loss of distant land-ice will impact local sea-level rise. These gradient maps show how ice loss from the Greenland Ice Sheet (left) and Antarctica (right) will affect sea-level rise near New York City. Ice loss from areas colored red will have a larger impact on New York's local sea-level rise, while melting in blue regions will have little to no impact on sea-level rise in New York. Antarctic melting will affect New York far more than Greenland melting. Credit: Larour et al., Science Advances, November 2017.
The relationship between melting glaciers and rising sea levels is best described as: “It’s complicated.” A new online tool shows just how counterintuitive predictions of how melting land-ice will affect coasts can be.
You might think, for example, that city planners in New York City should keep a wary eye on Greenland’s gradually shrinking ice cap, but as the new tool from NASA’s Jet Propulsion Laboratory (JPL) shows, melting in Antarctica, rather than Greenland, will likely have a greater impact on the northeast coast of North America. That’s because when melting redistributes the tremendous mass of water frozen in glacial ice, it has far-reaching effects beyond just adding water to the ocean. These effects run the gamut from causing local gravitational shifts and elastic rebound of Earth’s crust to slight changes in Earth’s rotational wobble in orbit. And those factors produce nonuniform patterns of sea-level change around the planet — known as sea-level fingerprints, says Eric Larour, a cryosphere scientist in the Sea Level and Ice Group at JPL.
When glacial ice melts, the loss of mass decreases the gravitational pull of the ice sheet, causing water to recede, Larour says. “This results in coastlines near where the ice has melted often seeing a decrease in sea level,” he says. “It’s counterintuitive, but the closer a city is to ice loss, the safer it may be from sea-level rise.”
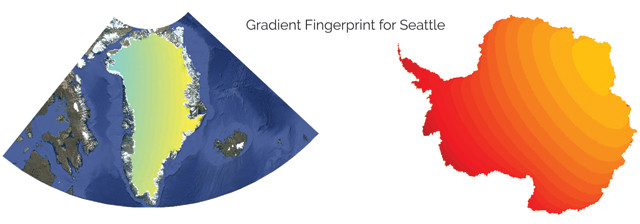
As in New York, sea level in Seattle will be more affected by melting in Antarctica than in Greenland. Credit: Larour et al., Science Advances, November 2017.
For example, cities in Scandinavia, such as Oslo, are close enough to the Greenland Ice Sheet that substantial ice loss will contribute to a significant local drop in sea level, Larour says. Like New York, Oslo will see a large rise in sea level with substantial melting in Antarctica — roughly 14,000 kilometers away — but much of that rise will be balanced by the sea-level decrease related to its relative proximity to Greenland, he adds.
This long-distance relationship between ice melt and variable patterns of sea-level rise “is very well-accepted,” Larour says. “The uncertainty lies in how much the ice is going to melt and where the water is going to go.”
In a recent study in Science Advances, Larour and colleagues reported a new method of mapping ice-thickness changes onto sea-level fingerprints. The method, called gradient fingerprint mapping, draws data on changing ice thicknesses from NASA’s ice-sheet models, and also takes into account local elastic rebound, global mean sea-level rise, and how mass changes from land-ice loss will alter Earth’s gravitational and rotational dynamics. It does not factor in thermal expansion of seawater due to warming, or the dynamic effects of ocean currents.
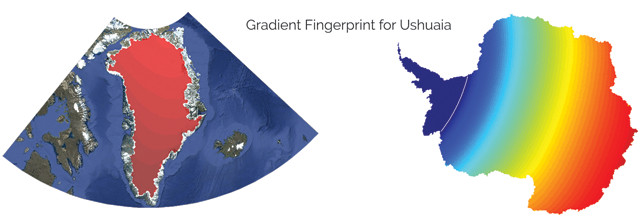
Sea level in Ushuaia, Argentina, is more influenced by ice melting in Greenland than in western Antarctica (blue). However, melting in eastern Antarctica (red) will also affect Ushuaia. Credit: Larour et al., Science Advances, November 2017.
An accompanying online tool allows users to select one of 293 port cities around the world to see how ice loss near and far could affect local sea levels. For example, selecting New York City on the map turns parts of Antarctica red, indicating that ice loss in western Antarctica will have a strong influence on sea-level rise in New York. Similarly, selecting Ushuaia, Argentina, on the southern tip of South America, turns parts of Antarctica blue — indicating it contributes to a decrease in Ushuaia’s local sea level — and Greenland red.
The results show the importance of where meltwater is discharged, even when it comes from the same ice sheet. For example, ice loss from the western part of the Greenland Ice Sheet strongly influences local sea-level rise in London, whereas local sea-level rise in New York is more sensitive to melt from drainages in the northeastern part of Greenland.
You can also select a city and the tool will provide the positive (rise) or negative (fall) percent contributions from various ice caps and glaciers around the world. For coastal planners, the ability to apportion the impacts that various ice masses around the world can have locally will help them calculate local sea-level rise more accurately as more reliable ice-loss predictions become available in the future, the authors noted.
The tool “is intended to help people see how different parts of the globe are connected,” Larour says, “which is not always in the ways you might think.”
© 2008-2021. All rights reserved. Any copying, redistribution or retransmission of any of the contents of this service without the expressed written permission of the American Geosciences Institute is expressly prohibited. Click here for all copyright requests.