
by Jerimiah Oetting Friday, May 11, 2018
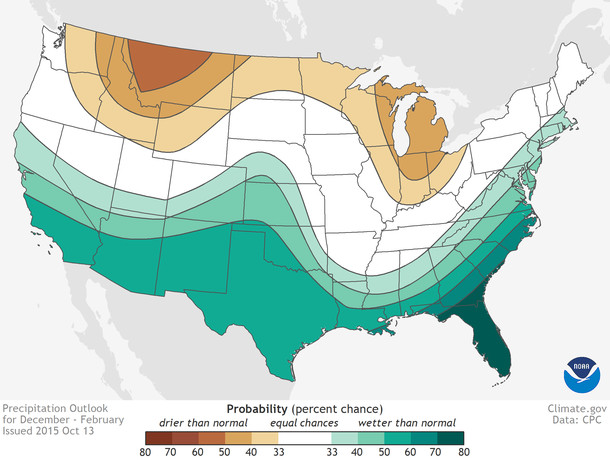
In October 2015, NOAA's precipitation outlook for the winter of 2015 - 2016 suggested the odds were good for a wetter-than-average winter across Southern California. Credit: NOAA Climate Prediction Center
Twenty years ago, the 1997–98 El Niño surpassed the 1982–83 event to become the strongest El Niño ever recorded, contributing to famine and drought in Southeast Asia, devastating floods in Southern California, and other natural disasters. By many metrics, the 2015–16 El Niño bested both to claim the title of the strongest El Niño on record. This most recent event, nicknamed the “Godzilla El Niño,” did contribute to extreme weather in parts of the world, including disastrous fires in Indonesia and the longest, global coral-bleaching event on record. However, it did not have the anticipated effect on California, which, at the time, was in the midst of a severe multi-year drought. In a recent study, researchers suggest the 2015–16 El Niño was the wrong “flavor” to bring heavy precipitation to the state.
An El Niño’s strength is gauged by the sea-surface warmth in a region of the tropical Pacific Ocean known to scientists as Niño 3.4. In early winter 2015, Niño 3.4 sea-surface temperatures (SSTs) indicated an El Niño on par with the 1982–83 and 1997–98 events — both of which produced intense precipitation over much of California. It was widely hoped the 2015–16 El Niño would have a similar outcome, helping replenish snowpacks and curtail water deficits in the state.
In October 2015, NOAA’s Climate Prediction Center predicted a 60 percent chance of above-average winter precipitation in Southern California. The odds diminished to the north, with the northernmost part of the state having equal chances of seeing normal, above- or below-average precipitation. But by spring 2016, it was clear the powerful El Niño hadn’t conformed to expectations in California. The state’s drought was reduced by slightly above-average precipitation in Northern California, but Southern California only received an average amount of rain.
“The first question was: Why was our forecast completely wrong?” asks Sang-Ki Lee, an oceanographer at NOAA’s Atlantic Oceanographic and Meteorological Laboratory in Miami, and lead author of the new study, published in Geophysical Research Letters. To answer this, Lee and his colleagues studied observational data of 25 El Niños between 1946 and 2016 to look for characteristics, other than just strength, that might impact rainfall over California. For example, they considered how El Niño strength changes over time, how long the events persist, and where maximum SSTs are concentrated.
“You cannot just use the Niño 3.4 index,” Lee says. “You really need to look at the spatial and temporal patterns of each El Niño. They’re all a little bit different in terms of where they have a maximum SST, and when they have a maximum SST.”
By plotting the location and magnitude of warm SSTs over the life of each event, the researchers showed when, where and how the El Niños developed and decayed. They noted four “frequently recurring flavors” of El Niño — persistent, transitioning, early terminating and resurgent — each with an associated rainfall pattern in California.
“If you look at the spatial and temporal distribution of [the 2015–16] El Niño, it is very different than the other two big El Niños,” Lee says. An El Niño that produces heavy rains for the entire state “has to be pretty strong and persistent … with a large, warm sea-surface temperature [anomaly] in the far eastern equatorial Pacific that continues throughout spring.”
This “persistent” El Niño is the only flavor that produces increased rainfall across the entirety of California, Lee says, and it’s rare. Only three of the 25 events examined, including the 1997–98 and 1982–83 El Niños, qualified as persistent. Historically, the other three El Niño flavors have done little to affect the state’s rainfall because they were either too weak, dissipated too early, or their warm surface waters were concentrated too far west. The 2015–16 El Niño, meanwhile, was a “mixed-flavor” event, perhaps explaining why California didn’t see much rain that winter: After showing signs of being a persistent El Niño, it became a “transitioning El Niño,” meaning it transitioned into a La Niña event.
While El Niño influences seasonal weather on regional and global scales, variations in daily weather are mostly attributable to “atmospheric internal variability,” says study co-author Hosmay Lopez, an oceanographer at the University of Miami. Could the lack of expected heavy rains several years ago simply have been due to inherent variability in the weather?
Internal variability also has a lot of influence on season-to-season rainfall, even during El Niño events, says Arun Kumar, a principal scientist at NOAA’s Climate Prediction Center. The NOAA forecast for the 2015–16 El Niño in California “was not wrong, if you ask me,” Kumar says. A 60 percent chance of above-average precipitation still allows for a 40 percent chance of another outcome. “If you are a gambler, and you bet on that particular forecast, then you were just unlucky.” So the forecast models weren’t necessarily incorrect, he says.
However, Kumar adds that understanding the El Niño categories may prove helpful. “If the results [of the new study] are proven correct, it will help in forecasting,” Kumar says. But such proof might be hard to come by because there is a dearth of observational data due to the infrequency of El Niño events, he notes. Simulated El Niño events can be used in models to test hypotheses and look for patterns in behavior. But the real test of whether, and how much, El Niño flavors influence weather, in California and elsewhere, will be seen in how future El Niño forecasts align with actual El Niño observations.
© 2008-2021. All rights reserved. Any copying, redistribution or retransmission of any of the contents of this service without the expressed written permission of the American Geosciences Institute is expressly prohibited. Click here for all copyright requests.