
by Mary Caperton Morton Wednesday, June 1, 2016
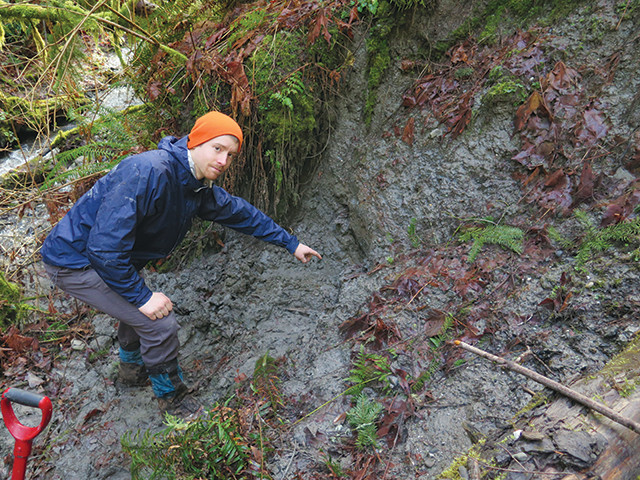
Sean LaHusen points to buried debris in a landslide deposit that predates the 2014 disaster on the North Fork of the Stillaguamish River. Credit: Alison Duvall/University of Washington.
On March 22, 2014, after a period of heavy rain, a hillside near the town of Oso, Wash., collapsed, sending 7.6 million cubic meters of mud and debris across the North Fork of the Stillaguamish River, destroying a rural neighborhood and killing 43 people. The slide took Oso residents by surprise, but scientists say the event was not altogether unexpected, as evidence for dozens of past landslides can be found throughout the Stillaguamish River Valley. New research suggests that large slides have occurred in the Oso vicinity even more frequently than previously suspected.
During the last ice age, about 16,000 years ago, the Cordilleran Ice Sheet extended from Canada into Washington’s Puget Sound. The ice sheet dammed many of the rivers flowing west out of the Cascade Mountains, building up massive deposits of fine clay and silt particles more than 200 meters thick in what is now the Stillaguamish River Valley.
“This is a setup for landslides: a lot of inherently unstable and impermeable material in a climate that gets a lot of rain,” says Sean LaHusen, a geomorphologist at the University of Washington and lead author of the new study published in Geology.
Lidar studies conducted before and after the 2014 Oso slide revealed 25 landslides up and down the Stillaguamish River Valley. The river is known to have begun cutting the valley through the glacial sediments roughly 12,000 years ago, suggesting an average recurrence rate of about 500 years based on the 25 landslides.
“But nobody knew how old any of the old slides were,” LaHusen says. To get an age for the valley’s landslides, LaHusen and colleagues, including Alison Duvall, also at the University of Washington, started by dating plant material in the Rowan and Headache Creek landslides, just downstream and upstream of the 2014 event, respectively. They found that the Rowan Landslide — approximately five times the size of the Oso slide — occurred between 300 and 700 years ago, and the Headache Creek Landslide is about 6,000 years old.
Then, with dates for three area slides, the team used lidar data to create what’s called a roughness curve for the 22 other slides along the 6-kilometer section of the valley studied. Roughness curves are commonly used to identify landslides in a landscape. But they may also be used to date adjacent slides, LaHusen says, as newer landslides tend to have rougher surfaces, which then smooth out over time due to erosion. The technique allowed the team to determine approximate dates for the remaining slides in the valley without having to radiocarbon date each one.
The researchers found that many of the Stillaguamish slides were younger than expected, less than 2,000 years old, meaning that landslides have been occurring more frequently in recent times, perhaps as often as every 140 years on average instead of every 500 years. “That’s a significant difference in recurrence rates, which are important when establishing hazard assessments for this valley,” LaHusen says.
“This is the first time that a team has used surface roughness as a dating technique,” even though the technique has been used a lot to identify landslides and distinguish them from surrounding terrain, says Richard Iverson, a hydrologist with the U.S. Geological Survey in Vancouver, Wash., who was not involved in the new study. However, he says, the surface roughness technique needs more testing to establish its validity as an absolute dating tool.
The next step should be to test the technique in a different location where a lot of landslides have occurred simultaneously, such as during a big earthquake, he says. This would help “test the validity of their assumption that all landslides begin with the same degree of surface roughness,” which “underpins” the whole study, Iverson says,.
Knowing the recurrence rate for landslides helps inform future hazard assessments, but it doesn’t help geoscientists predict when the next slide might occur, LaHusen says. The team did find evidence, however, for a pattern that might provide clues as to where the next slide could take place.
“There appears to be a close interaction between the location of the river and landslides,” LaHusen says. As the river erodes laterally into the glacial material, it destabilizes [valley] walls, leading to slides. Landslides of sufficient volume in turn block the course of the river, forcing it to the other side of the valley. The river starts “eroding the opposite side of the valley, triggering a landslide on that side,” and creating an alternating pattern.
LaHusen says a team led by Adam Booth at Portland State University plans to expand their study throughout the entire 25-kilometer-long river valley, which shows signs of more than 200 slides, to look at patterns in how the landscape is evolving. “Do landslides cluster in certain places? Or occur at certain intervals? These are patterns you can only tease out when you look at a larger area.”
© 2008-2021. All rights reserved. Any copying, redistribution or retransmission of any of the contents of this service without the expressed written permission of the American Geosciences Institute is expressly prohibited. Click here for all copyright requests.