
by Timothy Oleson Tuesday, May 1, 2018
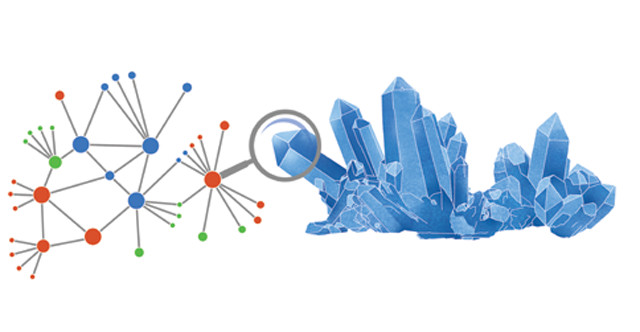
Missing Minerals graphic. Credit: Image credit: K. Cantner.
Fueled by advances in computing power and analytical methods, researchers in a growing number of scientific fields have taken to mining large datasets to reveal big-picture insights. By tallying the words that appear in a sampling of a book’s pages, for example, lexicologists — interested in tracking trends over time in language or literature — can mathematically predict the total number of distinct words in the book or, say, the number of different words containing a certain letter or certain combinations of letters.
Biologists apply similar techniques to estimate numbers and distributions of unknown species based on accumulated observations of known life. Such enumerations are a big part of efforts to illuminate Earth’s biodiversity, which is important not just in satisfying curiosity about the full breadth of life’s past and present, but also in applications to improve agriculture or conservation efforts, study disease pathology and transmission, and search for useful medicines.
Like biologists searching for undiscovered species, mineralogists have long sought to fill in the picture of Earth’s mineralogical diversity with new finds. In recent years, mineralogists, teamed with mathematicians and others, have begun using statistical models and data science methods traditionally applied to study large datasets in fields like linguistics, evolutionary biology and social network analysis. The researchers hope to reveal previously unseen patterns and clues hidden in mineralogical databases about Earth’s mineral diversity, and find undiscovered minerals — an effort that could enlighten our basic understanding of how our planet formed and has changed over billions of years, offer insights about the locations and largesse of deposits of critical natural resources, and even unearth information about the histories of other rocky planets.
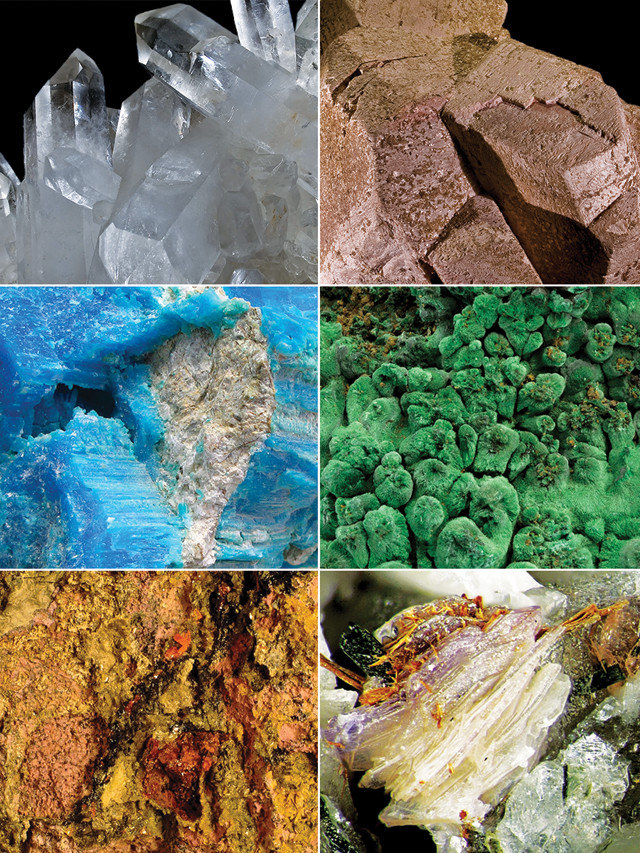
Among the more than 5,300 recognized mineral species are common rock-forming minerals, such as quartz (top left) and orthoclase (top right). Others, such as the colorful, copper-bearing minerals kröhnkite (middle left) and malachite (middle right), are less common but still known from many localities. Most minerals, however, are documented based on just a few known occurrences. Petterdite (pink mineral at bottom left, seen with yellow cerussite) has been reported from just two locations, according to Mindat, while martinite (bottom right) has only been reported from a single site. Credit: Clockwise from top left: Didier Descouens, CC BY-SA 4.0; Didier Descouens, CC BY-SA 4.0; ondra244, public domain; Modris Baum, public domain; Ralph Bottrill, CC BY 3.0; Ra'ike, CC BY-SA 3.0.
The International Mineralogical Association (IMA) currently recognizes 5,327 distinct mineral species. Some, such as the major rock-forming silicates and carbonates, are well known and found in abundance the world over. But most are documented based on just a few known occurrences. It’s unlikely that scientists will stumble across many new finds of singularly abundant minerals on Earth, but numerous rare minerals are probably yet to be discovered.
“We have a very rich and diverse crust of our planet,” says Bob Hazen, a mineralogist at the Carnegie Institution for Science in Washington, D.C. “We’ve explored a lot of it, but there’s a lot that remains unexplored,” he says. “And what we suspect, what we know … is that there are a lot of minerals just waiting to be found,” he says.
In fact, new species continue to be identified frequently. In just the last decade, roughly 1,000 new minerals have been added to the IMA’s rolls, thanks mostly to advanced instruments that have allowed researchers to resolve discrete crystal structures, often in tiny grains of material, with increasing clarity. Nonetheless, the exploration process, whether in the field or the lab, still relies heavily on educated guesswork about where to look — and on luck. “We’d love to be able to predict: What are those missing minerals, and where do you go to find them?” Hazen says. In other words, “how do we make this an active search rather than just serendipitous discovery?”
Considering how long mineral hounds, professional and amateur alike, have been scouring Earth’s surface, it might be hard to imagine there could be many minerals left to find. But there is no shortage of potential mineral compositions or structures, as demonstrated by the vast range of crystalline compounds that have been created synthetically. And there are plenty of reasons why mineral species might have been previously overlooked.
For example, mineral hunters have historically been drawn to big, colorful, valuable or otherwise remarkable specimens. But many minerals do not fit any of those criteria. Additionally, some minerals are only stable under a narrow range of pressure and temperature conditions, or they aren’t stable under the conditions near Earth’s surface. Bridgmanite, for example, is perhaps the most abundant mineral on the planet, constituting the bulk of the lower mantle, but it is essentially absent from Earth’s surface, and was only formally recognized in 2014.
“Maybe it’s because they’re small or obscure, maybe it’s because they’re buried, maybe it’s because they’re hiding in plain sight and they look like something else that is familiar, so we just walk right over them,” Hazen says. Whatever the case, “there are probably thousands of mineral species that are simply not yet described, but which exist.”
Several years ago, Hazen and his colleagues realized that the large amount of existing information in databases, such as the University of Arizona-based RRUFF Project and the Mindat website, which collects both literature- and crowd-sourced information, could offer clues about the number, nature and whereabouts of these unknown minerals.

By sampling a book's pages, lexicologists can mathematically predict the total number of distinct words in the book, or the number of different words containing a certain letter or combinations of letters. Mineralogists can use similar modeling to predict the total number of minerals on Earth, or the total number of minerals containing certain elements. Credit: Timothy Oleson.
In 2014, Hazen, along with mathematician Grethe Hystad of Purdue University Northwest and others, began analyzing the hundreds of thousands of mineral-locality pairings collected in Mindat. Each report of a given mineral at a specific location in Mindat represented a single datum, and collectively, the dataset provided a “frequency spectrum” of Earth’s known minerals, charting the number of different species known from only one site on the planet, followed by the number known from two sites, three sites, and so on. The plot highlighted the striking disparity between the large number of rare minerals compared to the relative few found at many locations.
Hazen recognized that the team’s data resembled so-called Large Number of Rare Events (LNRE) distributions described by exponentially decreasing mathematical functions. Such patterns are seen in the uneven numbers of species in plant and animal populations, and of different words in books. Whereas roughly one-fifth of the recognized minerals at the time were known from only a single site, and one-third from one or two sites, just 2 percent were known from more than 1,000 sites. “You see kind of the same pattern in word frequency distribution [in books],” Hystad says, which tend to contain a large proportion of infrequently used words compared to relatively few frequently used words.
In a 2015 study published in Mathematical Geosciences, Hystad, Hazen and Robert Downs of the University of Arizona applied LNRE modeling to the mineral-locality dataset from Mindat. After fitting the data to LNRE functions, they estimated that Earth’s total inventory of minerals should number at least 6,394 — or 1,563 more than the 4,831 that were recognized at the time. It was, Hystad notes, the first quantitative prediction of Earth’s total mineral inventory using such a technique.
The researchers also used LNRE modeling to predict how many missing minerals contain specific elements, which may suggest where to look for untapped mineral diversity. For instance, in a 2015 study in American Mineralogist, they found that an estimated 496 sodium-containing minerals — 35 percent of the total predicted number — are likely undiscovered, while the percentage is somewhat lower for most other elements, such as silicon (28 percent), aluminum (27 percent), sulfur (18 percent) and copper (17 percent). The disparity, they suggested, is probably due in part to anthropogenic sampling biases against sodium minerals, which are typically nondescript looking and not especially valuable compared to, say, the colorful crystals of many sulfur and copper minerals. Some sodium minerals also dissolve easily in water, making them unstable across much of Earth’s surface. This sort of observation “illustrates the great promise of exploiting ever-growing mineral data resources, coupled with the application of powerful statistical methods,” the researchers wrote.
But applying the same LNRE models developed for parsing books to predicting missing mineral populations has its shortcomings, mainly because the types of data — words on a page versus minerals on Earth — aren’t exactly analogous. “When you’re looking at a book, you can see all the words,” Hystad says, so each word stands an equal chance of being observed. That’s hardly the case with minerals. In addition, the LNRE predictions assume that the methods used to observe the data remain unchanged — a safe assumption for lexical statistics, but not for mineral exploration.
“The way we discover minerals keeps changing,” Hazen says. Early mineral finds were made by identifying them in hand samples or under light microscopes. More recent discoveries have required researchers “to use X-ray diffraction or an electron microprobe or a transmission electron microscope — as you get more and more sophisticated techniques, many more minerals become accessible,” he says, even if fewer people have the means to find them.
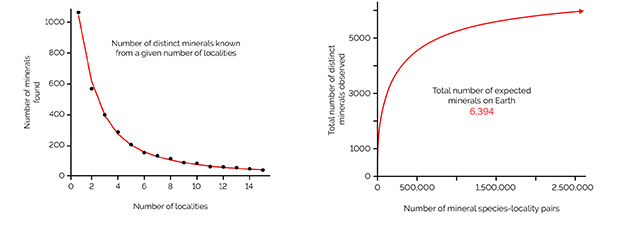
In a 2015 study, Hystad et al. plotted the frequency spectrum of known minerals (left). Points represent the number of distinct minerals known from a given number of localities, while the curve is a mathematical fit of that data from Large Number of Rare Events (LNRE) modeling. (Note that common minerals known from more than 15 localities are factored into the modeling but not indicated here.) From the same dataset, the researchers also estimated the total number of minerals on Earth — including as yet unknown species — from an "accumulation curve" (right). As the number of mineral-locality observations increases, according to the team's LNRE modeling, the number of distinct minerals observed also rises, eventually plateauing at 6,394. Credit: K. Cantner, AGI, data from Hystad et al., Mathematical Geosciences, August 2015.
For now, the team is continuing to refine the models it has worked with so far, as well as to investigate other approaches to predict mineral diversity. Currently, Hystad says, the best estimate for the minimum total number of minerals is about 9,300 — already 3,000 more than their initial estimate.
“Ultimately, we need to develop our own mathematics,” Hazen says, which probably means developing a novel, “composite” LNRE model to account for the various ways in which minerals can be observed and discovered. Developing the complex mathematical functions for such a model won’t be easy, he says, as this is a “frontier area” in applied mathematics. But “I think when we do, what we’ll find is that each time a new technique is discovered, the number of predicted missing minerals will increase quite dramatically.”
With more than 5,300 known minerals — each with its own array of physical and chemical traits — documented from recorded findings from nearly 300,000 localities around the world, there is simply too much mineralogical data available for the human mind to handle all at once, Hazen notes. “Understanding how nature works, how Earth works as an engine of selecting, concentrating, and separating elements into different rocks and mineral types” is a problem with too many dimensions, he says. But if we “let the data show us what the principal trends are, we’re going to make discoveries we never could have made before.”
He and his colleagues have recently turned to the tools of network analysis to help see these trends. Network analysis combines numerical algorithms and visualization methods to make large, unwieldy datasets more digestible. It has been applied in numerous ways, from studying the structure of electric power grids to mapping the spread of disease, although one of the most familiar uses today is in visualizing, analyzing and predicting (or suggesting) connections among individuals and groups in social networks.
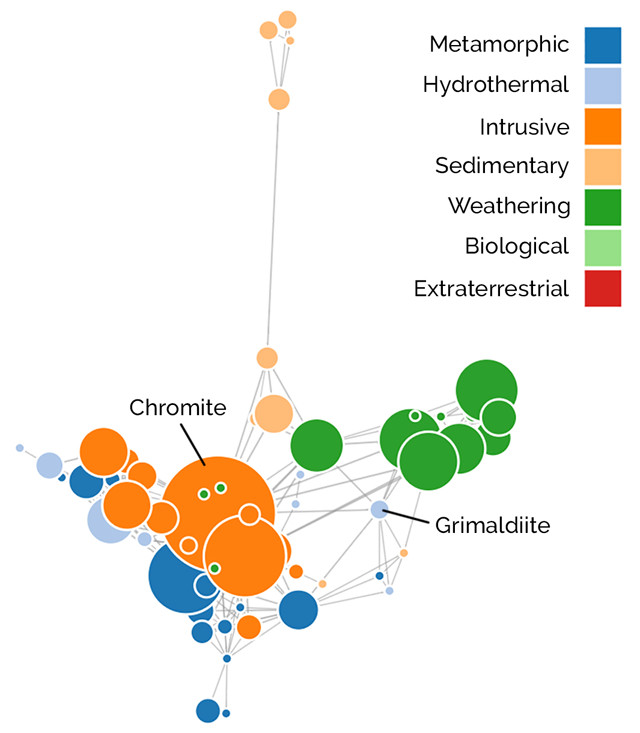
A network diagram of 58 chromium minerals shows that they segregate based on the manner or environment in which each predominantly forms. Node sizes are proportional to the number of localities from which each mineral is known, and the distance between two connected nodes is proportional to the number of localities at which the two co-occur. Exceptions to the segregation rule include some abundant chromium minerals like chromite, as well as certain hydrothermally formed species, like grimaldiite, which do co-occur with species from other groups. An interactive version of this diagram is viewable at https://dtdi.carnegiescience.edu. Credit: Morrison et al., American Mineralogist, August 2017.
Network diagrams can take many forms and shapes but typically consist of two main features: points, or nodes, each of which represents a single entity — a particular mineral, for example — and connecting lines, or edges, which denote some relationship between two nodes. At their most basic, these diagrams can be simple and largely qualitative, as in friend networks or family trees, where connections imply direct relationships — whether by social interaction or genealogy — but little more. Or they can be made to hold much more information: Nodes can be different sizes, shapes and colors based on certain qualities of whatever it is they represent. Connections, meanwhile, can be different lengths or weights, for example, to indicate the duration or status of a relationship, or perhaps the number of places where two minerals are known to co-occur.
There is virtually an unlimited number of ways to view and parse large datasets with network diagrams. Researchers can set up networks to answer particular questions or, alternatively, if the goal is more explorative, to search for potential lines of inquiry. In any case, network analysis “allows us to look at many variables at once,” says Shaunna Morrison, a mineralogist also at Carnegie. Compared to using traditional two- or three-dimensional X-Y plots or ternary diagrams to study mineral relationships, for example, “we’re able to get a much fuller picture of what’s going on — mineralogically, chemically, geologically.”
Morrison, Hazen and their colleagues are still in the early days of pioneering quantitative network analysis tools for mineralogy. But in an initial study published last summer in American Mineralogist, they concluded that “mineral network analysis, by combining the potential of big data mineralogy and accessible visual esthetic, represents a powerful new method to explore fundamental problems in mineralogy and petrology.”
In the study, led by Morrison, the team used numerical algorithms to plot network diagrams and illuminate relationships in various mineral subsets, again based on data from Mindat. Displaying information about existing minerals in such diagrams could help direct researchers looking for unknown minerals or ore deposits, they wrote. In some diagrams, nodes signified individual minerals, node sizes reflected the commonness of each, and the length of connections represented how often minerals co-exist at the same locations. Accounting for all of the data simultaneously, the algorithms iteratively adjust the nodes’ positions to minimize the volume of the overall diagram while maintaining the correct relative distances among the different nodes.
A plot of several dozen chromium-bearing minerals, for example, appears something like a deformed “plus” symbol, the shape resulting from the minerals’ segregation based on the manner or environment in which each predominantly forms. The observation that chromium minerals — whether igneous, metamorphic, hydrothermal, etc. — tend to be found primarily alongside others from their same “paragenetic” group may be intuitive for mineralogists or geologists, but the diagram nonetheless displays the overall relationship among dozens of minerals in far more detail than is possible in simpler diagrams. It also reveals finer-grained insights, the team noted, including exceptions to the segregation rule; for example, some abundant chromium minerals, like chromite, as well as certain hydrothermally formed species, do co-occur with many species from other paragenetic groups.
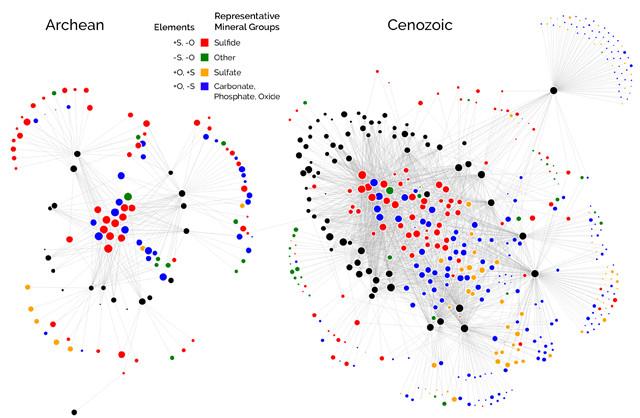
Network diagrams of copper minerals (colorful nodes) known to have existed in the Archean Eon (left) and the Cenozoic Era (right) show how copper mineral diversity has grown dramatically through geologic history. Archean copper mineralogy was dominated by copper sulfide minerals; in the Cenozoic, sulfides are still prominent but oxygen-containing groups like sulfates, carbonates and phosphates have also proliferated. Black nodes in these "bipartite" diagrams represent regions in which connected copper minerals occur. Credit: Morrison et al., American Mineralogist, August 2017.
The researchers also created a pair of networks that incorporated two different types of nodes (instead of just one); the nodes signified either a particular copper-bearing mineral or a locality where copper minerals are found. One of the networks included sites and minerals dating to the Archean Eon, while the other related to the Cenozoic Era. This allowed the team to compare mineral trends within and between time periods separated by 2.5 billion years. They noted, for instance, the dominance of copper sulfide minerals (containing sulfur but not oxygen) and shortage of copper sulfate minerals (containing sulfur and oxygen) in the Archean, prior to the oxygenation of Earth’s atmosphere. In the recent Cenozoic, from which there is far greater copper mineral diversity known, sulfides are still prominent but oxygen-containing groups like sulfates, carbonates and phosphates have also proliferated, particularly among the many rare copper minerals.
The observation that minerals that form in low-oxygen environments versus high-oxygen environments cluster together is “not entirely surprising,” Hazen says. “What was new and what had not been described in the network [analysis] literature before is that, embedded in the networks, are axes that show you compositional trends, temporal trends and other aspects, including, surprisingly, things like the hardness of the minerals and the complexity of their crystal structures … even though [none] of that information [was used] in creating the networks,” he says. “We’re finding that … because we’re working with natural systems that have lots of structure to them, those structures are reflected in the topologies, in the geometries, of the networks in ways that simply haven’t been seen.”
With these data science techniques, “we’re able to really make mineralogy predictive, instead of just descriptive,” Morrison says. And, Hazen adds, the potential value of this transition from description to prediction is already being demonstrated.
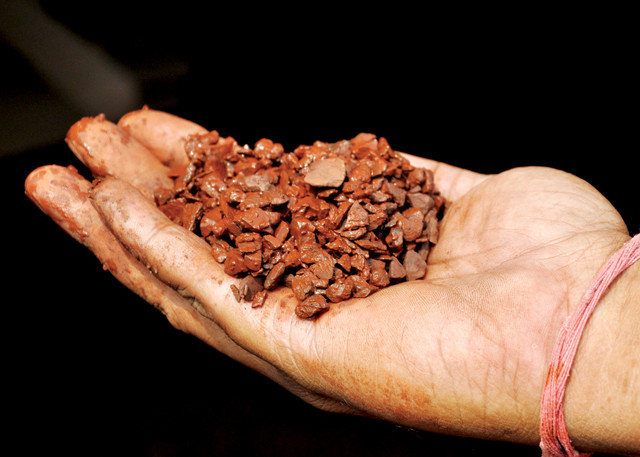
Data science techniques could be useful in analyzing mineral assemblages at established ore deposits, which could then shed light on where other potentially valuable deposits are located. Credit: Peter Craven, CC BY 2.0.
In a 2016 study in American Mineralogist, Hazen and his colleagues used the LNRE models they’d developed to analyze occurrence data for the 403 carbon-bearing minerals known at the time. They predicted that at least an additional 145 carbon minerals have yet to be found, and suggested, based on additional analyses of subgroups of existing carbon minerals (minerals containing both carbon and oxygen, or carbon and calcium, for example), that most of these undiscovered species are likely to be hydrous carbonates. They also offered several hundred plausible compositions for the unknown minerals.
Since then, 13 new carbon minerals have been discovered, six of which are hydrous carbonates, and two of which were found in samples from a mining district in the Czech Republic that the team had specifically cited as a likely spot for many undiscovered species. Furthermore, two of the 13 finds — dubbed abellaite and parisite-(La) — have compositions the team specifically proposed. While the team’s 2016 predictions didn’t necessarily lead researchers to these specific finds, the research shows how the data science techniques the team is developing could be put to use, Hazen says. “If you know exactly what to look for, you have the opportunity to go out and find it.”
The approaches the team is developing may also be useful in revealing new or underutilized deposits of existing mineral resources. Morrison is currently adapting an algorithm known as market basket analysis, which online retailers use to suggest products to shoppers, to take advantage of mineralogical databases — a step beyond the statistical modeling and network analysis they’ve done to date.
The algorithm tracks purchases, then “it compares those purchases to its huge database of customers, and it can tell you pretty accurately what you might want to buy, even though sometimes those [products] are seemingly unrelated,” Morrison says. With respect to minerals, the idea is to be able to look at known mineral assemblages and give probabilities for the occurrence of other minerals. For example, “based on what minerals form here … there’s a 90 percent chance that mineral X is also going to form here.” It would also work for predicting co-located mineral combinations, she says. “Some mining companies are probably going to be interested in: ‘Where do I find this combination of three minerals because that means something economically significant?’ And we’ll be able to make that prediction.”
azen says there has already been a lot of interest in how the research relates to resources and mining. In late April, the researchers held a workshop at the Colorado School of Mines to meet with economic geologists and discuss applications in terms of resource discovery. That followed a 2017 workshop with the U.S. Geological Survey (USGS), which considered how big data and data science approaches like theirs could improve resource assessments.
Although USGS isn’t directly involved in mineral exploration, the agency’s Mineral Resources Program develops publicly accessible assessments of existing and potential resources. “Of current interest are questions like: Where will we find future supplies of critical minerals? [And] will increasing global demand create mineral supply shortages, which could potentially lead to conflict or protectionism?” says Gilpin Robinson, a geologist at USGS Eastern Mineral and Environmental Resources Science Center in Reston, Va., who co-organized the 2017 workshop. “Our resource assessment projects have to integrate and evaluate large amounts of data … so we’re always looking for methods to improve our ability to do this, and to improve the resource assessment results,” he says.
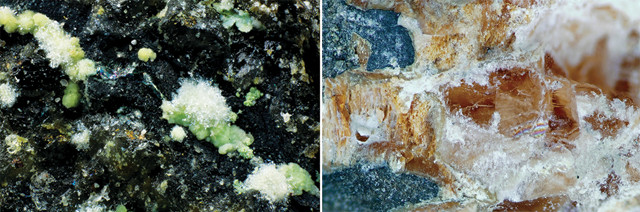
Abellaite (left) and parisite-(La) (right), both rare carbonate minerals, are two of more than a dozen carbon-bearing minerals newly recognized in the last couple of years. Credit: left: Matteo Chinellato, CC BY-SA 4.0; right: courtesy of Shaunna Morrison.
USGS is still scoping out how data science techniques could be applied in its assessments, Robinson says. One potential use is analyzing patterns in mineral assemblages at established resource deposits, which could then shed light on other potentially valuable localities recorded in Mindat and other databases.
“We are virtually certain there will be new deposits,” Robinson says, adding that the future likely lies in locating deeper resources that are still shallow enough to reach. “The question is how you find them,” he says, which is where the ability to mine large datasets with data science might come in. “It’s kind of like exploring for oil and gas,” he notes. There’s been speculation in the past that we’ve found most of the available resources, “but then people come up with a new idea and find new places where those deposits are.”
In addition to aiding in mineral discovery and resource assessments, applying data science methods in mineralogy may also be useful in the classroom, where interactive network diagrams loaded with information about minerals and their relationships in nature could supplement or replace traditional teaching tools, Hazen and Morrison say.
And there are uses in planetary science. In a 2017 study in Mathematical Geosciences, Hystad and others applied LNRE modeling to demonstrate that Earth’s mineralogy is unique: They calculated that the probability of exactly duplicating the planet’s roughly 5,000 known minerals on another rocky planet is less than one in 10263. In the same study, the researchers described a way to statistically quantify how “Earth-like” (a notoriously vague term among planetary scientists) a planet is based on what we know about its mineralogy and how it compares to the frequency distribution of minerals on Earth.
“We’re really interested in understanding the history of Mars … and if there are any potential biosignatures that we can tease out of the mineralogical relationships that we’re seeing on Earth,” Morrison says. The proliferation of rare mineral species on Earth is thought to be tied to the rise of life, so it’s possible that Earth’s overall LNRE pattern of mineral distribution is a biosignature. So far, “it seems, based on the rover data and the meteorite data, that [Mars] does not have the mineral diversity and this large number of rare species that we see on Earth,” Morrison says. She notes, however, that scientists have only studied a tiny portion of the planet in detail, and that the team’s work applying data science to look more closely at Mars’ minerals is just beginning.
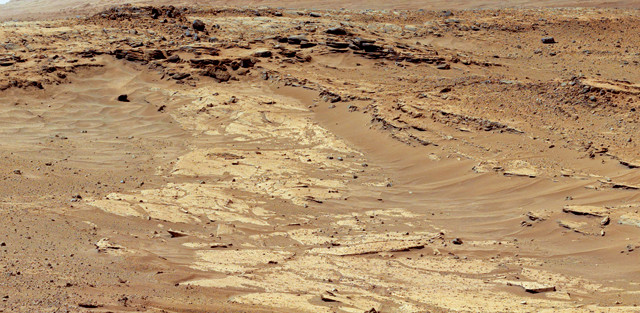
In addition to illuminating mineral diversity on Earth, data science methods could reveal information about the mineralogy and history of Mars and other rocky planets. Credit: NASA/JPL-Caltech/MSSS.
“We don’t see this as just a mineralogical approach. We see this as a data-driven discovery approach that applies to an incredible range of aspects in the earth and life sciences,” Hazen says. He notes other recent collaborations his team has struck up with paleontologists looking to quantify missing portions of the fossil record, which could impact our understanding of extinction events or evolutionary rates, as well as microbial ecologists looking to apply network analysis to better understand the influence of environmental factors like local mineralogy and geochemistry on microbial communities.
The team’s research employing data science is developing “incredibly fast,” Hazen says. “We’re seeing the beginning of a revolution in the way we think about scientific discovery, using these large data resources to see trends, correlations and relationships that the human mind simply cannot see because they go way beyond just an X-Y plot.”
© 2008-2021. All rights reserved. Any copying, redistribution or retransmission of any of the contents of this service without the expressed written permission of the American Geosciences Institute is expressly prohibited. Click here for all copyright requests.