
by Kathryn Hansen Thursday, January 5, 2012
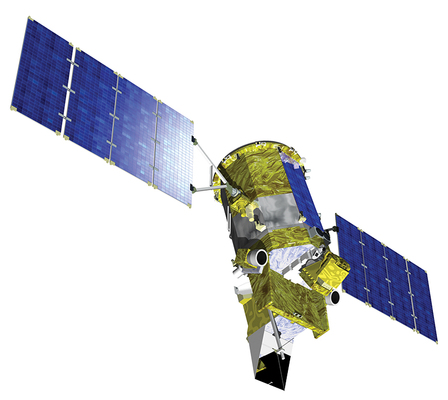
NASA's Glory satellite will launch by the end of 2010. NASA
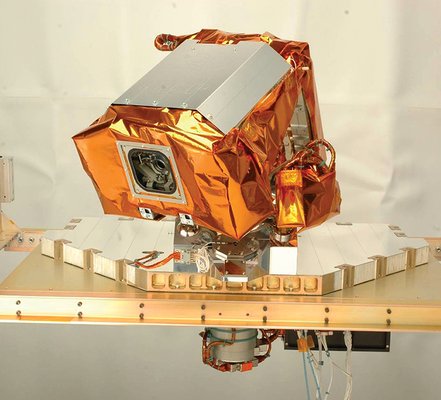
The TIM instrument will measure total solar irradiation. NASA
Launched in January 2003, NASA's Ice, Cloud and land Elevation Satellite (ICESat) is examining changes in ice and land masses on Earth. ICESat will be replaced by its successor, ICESat-II, in 2014. NASA
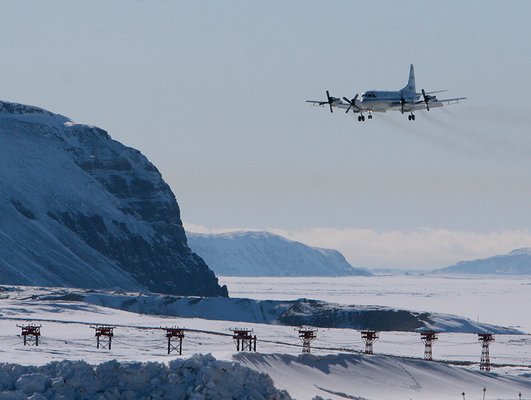
A NASA P-3B aircraft makes its final approach into Thule Air Base in Greenland. NASA
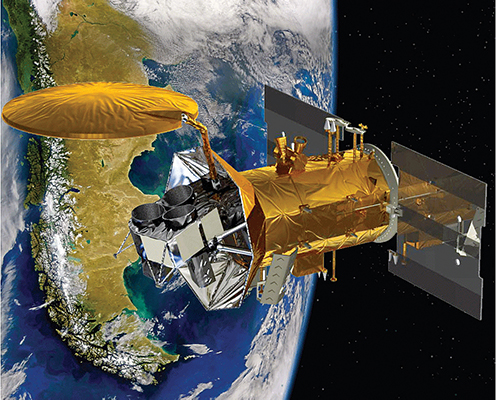
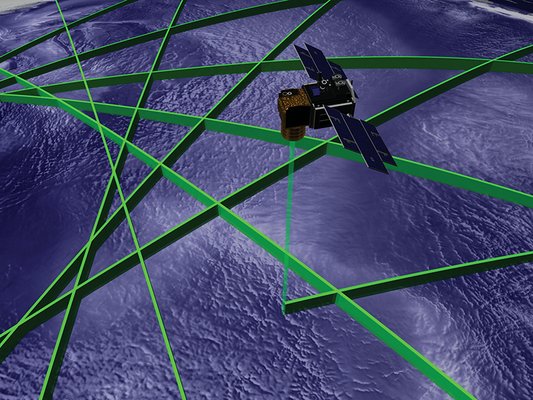
Aquarius, scheduled to launch in 2010 aboard Argentina's SAC-D spacecraft, will measure changes in ocean salinity. NASA
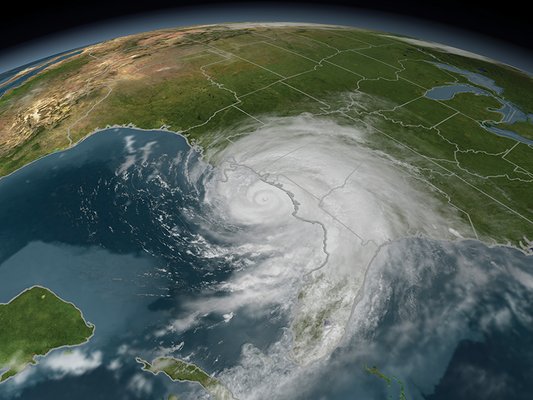
The GRIP campaign will help researchers get highly accurate measurements of rapid intensification or other changes in a hurricane. NASA
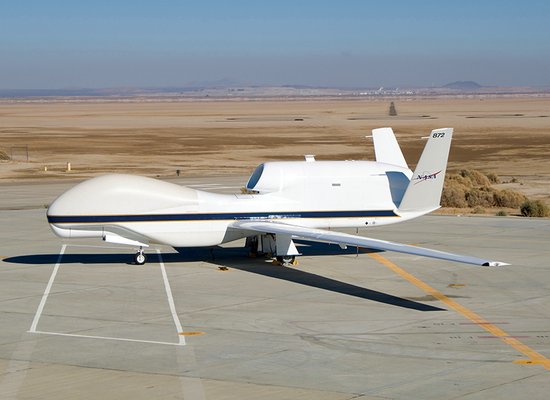
The unmanned Global Hawk aircraft will fly over hurricanes while onboard instruments take continuous measurements. NASA
In 2009, we saw a number of changes on Earth. The average global ocean surface temperature last summer was the warmest on record. Thin seasonal ice has recently replaced thick older ice as the dominant type of ice in the Arctic. And scientists saw that despite a quiet sun with few sunspots, Earth can continue to be bombarded with a high level of solar energy.
These events relate to a primary question that drives earth science research and exploration at NASA: How is Earth changing and what are the consequences for life? To discover the answers, scientists strive to maintain the best-possible record of Earth’s changes through time. Toward that goal, NASA and its partners are planning new earth science satellite missions and field campaigns for 2010 — all of which ensure that we maintain a near-constant watch on our changing planet.
To better monitor and measure the atmosphere, NASA plans to launch the Glory satellite by the end of 2010. One instrument will detect atmospheric aerosols, tiny particles suspended in the atmosphere, to help scientists accurately assess their composition, size and global distribution. And a second instrument will keep watch on a distant object that provides nearly all the energy input to Earth’s climate system: the sun.
Total solar irradiance — the amount of solar energy striking Earth’s upper atmosphere — changes by 0.1 percent through the sun’s 11-year magnetic cycle. Many scientists think that’s not enough to impact warming trends observed over the last century, but to be sure how much of that change comes from the sun and how much from human activities, scientists need a continuous and reliable record of solar energy.
“NASA has helped maintain a 30-year record of incoming solar energy, by far the largest driver of Earth’s climate system, with a series of instruments that help today’s climate scientists separate solar effects on climate from human-caused effects,” says Greg Kopp, a physicist at the University of Colorado at Boulder, and leader of the Total Irradiance Monitor (TIM) science team on Glory. “Because the sun changes on short and long timescales, continuity of these solar irradiance measurements will improve our understanding of climate influences.”
The TIM instrument on Glory will continue this uninterrupted record of total solar irradiation. A similar instrument was launched in 2003 on the Solar Radiation and Climate Experiment. In all, various forms of the space-based solar monitors have flown since 1978 on 10 missions launched by NASA, NOAA and the European Space Agency. Scientists anticipate the TIM will be nearly three times more accurate than previous instruments, helping determine long-term changes in the sun’s output that impact climate.
“As nations determine climate policies, they need to know what climate effects are due to humans and what are purely natural,” Kopp says.
NASA’s fleet of aircraft complements space-based satellite observations. In 2010, the airborne laboratories will be specifically applied to maintaining a record of change at Earth’s polar regions, as part of NASA’s Operation Ice Bridge.
Since 2003, NASA’s Ice, Cloud and land Elevation Satellite (ICESat) has orbited over Earth’s polar regions, providing ice-surface elevation data, which scientists use to learn how ice thickness changes with time. By spring 2009, ICESat had completed almost 2 billion measurements from orbit, but the satellite’s lasers were weakening and the satellite’s successor, ICESat-II, is not scheduled to launch until about 2014.
To bridge the gap between the satellites, NASA pilots, crew and researchers will fly over select parts of the poles in airplanes that have been fitted with lasers, ice-penetrating radar and gravity instruments to collect critical information about changes to glaciers, ice sheets and sea ice. In spring and fall 2009, NASA flew over Greenland and Antarctica, and flights will resume in spring 2010 over Greenland. Aircraft do not provide the same expansive view as satellites, but they allow a record of changes to select sensitive, critical targets of interest to be maintained.
“We’re trying to concentrate on the glaciers most subject to rapid change, such as those in the Antarctic Peninsula and in the vicinity of the Pine Island and Thwaites glaciers,” says Seelye Martin, chief scientist of Operation Ice Bridge, based at the University of Washington in Seattle. Scientists suspect that the Pine Island Glacier is particularly sensitive to regional warming. If all its ice were discharged into the sea, global sea levels could rise by a meter or more. “This is why it is particularly important to monitor this and other sensitive regions,” Martin says.
In the Arctic, researchers want to keep watch on changes to sea-ice thicknesses and volume, the rapid decline of which affects humans, ocean circulation, climate and ecosystems. “If it all works out, from ICESat-I and Operation Ice Bridge to ICESat-II, we’ll have a 15- to 20-year record of these changes, which will give us a nice time series as to how the ice sheets and sea ice are changing,” Martin says.
Less obvious to human eyes than ice changes is a shift taking place at the surface of Earth’s ocean: Saltiness is increasing in some places and decreasing in others. Meltwater from polar ice, precipitation and river runoff freshen some regions of the ocean surface, particularly at the poles.
Meanwhile, the subtropical Atlantic — where evaporation is exceeding
precipitation — has been getting gradually saltier. These shifts in
ocean salinity, toward fresher or saltier water, could lead to big
changes in Earth’s water cycle, ocean circulation and climate. But how
exactly do all the pieces fit together? Scientists hope to find out with
the 2010 launch of Aquarius, scheduled to fly on the SAC-D spacecraft
built by Argentina’s space agency.
Aquarius will be the first U.S. remote sensing tool to measure
sea-surface salinity, “so the mission has a flavor of discovery,” says
Yi Chao, a project scientist for Aquarius based at NASA’s Jet Propulsion
Laboratory in Pasadena, Calif.
Buoys and instruments deployed from ships have long provided a valuable record of ocean salinity. Ocean-based measurements, however, can be difficult to obtain due to rough sea conditions and the limited route of hired ships. And with about 71 percent of Earth’s surface covered by water, expansive coverage proves a continuous challenge.
The new space-based salinity measurements from Aquarius will cover the
entire planet every seven days. These measurements can then be combined
with ocean-based profiles to achieve a 3-D view of ocean salinity
patterns.
“We consider monitoring salinity from space to be a missing piece of the
ocean and climate puzzle,” Chao says. “Without Aquarius, we would not
have the needed dataset to study, understand and ultimately predict the
global water cycle, ocean circulation and its impact on climate.”
While satellites keep steady, periodic tabs on our planet, some targets on the move — such as hurricanes — benefit from much more rapid observations. Next August and September, NASA will launch the Genesis and Rapid Intensification Processes (GRIP) campaign based out of Fort Lauderdale, Fla. The field campaign involves flights of instrumented manned and unmanned aircraft over and through potential hurricanes.
As the name implies, we will address questions about the processes that lead to the formation of storms and rapid changes in intensity using a unique suite of instruments and, for the first time, an unmanned Global Hawk aircraft capable of staying over storms much longer than most aircraft," says Scott Braun, one of the lead scientists for GRIP, based at NASA’s Goddard Space Flight Center in Greenbelt, Md.
Instruments on Earth-observing satellites record some details about hurricane location and structure, providing an important component for existing models used by hurricane forecasters. But satellites provide just a few looks a day. And when hurricanes change on timescales of minutes, hours and days, satellites can miss the critical moments of a hurricane’s life. “It’s difficult to observe a storm at the right time when intensity change is occurring,” Braun says.
To get a closer look at the critical moments, GRIP will utilize the unmanned Global Hawk aircraft, which will fly in the Gulf region over hurricanes while onboard instruments make continuous measurements for about 24 hours — almost three times longer than is possible on other NASA aircraft. The larger, piloted DC-8 will also participate, collecting data as it flies through storms.
The exact nature of the processes that lead to storm formation and intensification has been elusive, but important strides forward are possible with GRIP, Braun says.“To get a representative sample of storms and the variety of ways in which they evolve, you need to do things over a period of years,” he says. “From our previous campaigns, Hurricane Dennis in 2005 is the only good case of rapid intensification that we have. The long flight duration of the Global Hawk will allow us to reach storms much earlier, prior to their intensification, improving our chances of getting the critical observations that we need.”
© 2008-2021. All rights reserved. Any copying, redistribution or retransmission of any of the contents of this service without the expressed written permission of the American Geosciences Institute is expressly prohibited. Click here for all copyright requests.