
by Allison Mills Tuesday, September 2, 2014
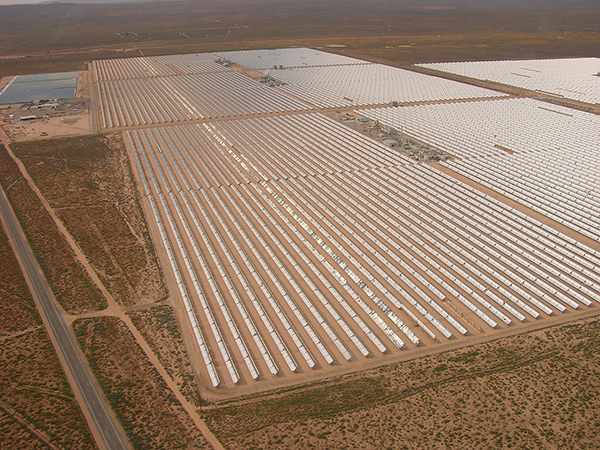
Large concentrated solar power plants, like this one in the Mojave Desert, have big a footprint on landscapes. Credit: Alan Radecki.
Studying the landscape-scale impact of energy development, especially renewable energies, requires working at the interface where policy, business, activism, scientific research and stakeholders overlap. But determining broad-scale impacts comes down to having solid data — on key species, slope aspect, transmission distance and more — to understand and predict what happens on energy landscapes. Collecting, analyzing and sharing such data was the focus of several symposia at last summer’s North America Congress for Conservation Biology meeting in Montana.
The California Desert Renewable Energy Conservation Plan (DRECP) is one of the first — and biggest — attempts to manage and plan for energy development on a large scale. The plan covers about 9 million hectares, modeling habitat and resource needs for 52 species, while simultaneously streamlining the permitting process for some of the best solar development sites in the nation. “This particular plan is really ambitious and really pushes the boundaries, so there’s a lot we’re going to learn,” says Scott Flint, a biologist with the California Energy Commission who is the DRECP project leader.
Complicating the difficulty of gathering data is the “social challenge” — incorporating in-depth technical knowledge from industry stakeholders and accommodating residents who “don’t want to see powerlines, don’t want to see a huge facility next door,” Flint says. To minimize potential conflicts through optimal project siting, Flint and his colleagues use population models and land-use information to determine areas that maximize various parameters, such as conservation, development or agriculture. In the case of the DRECP, the projects being sited are utility-scale wind, geothermal and solar, which occupy space and affect the sensitive desert ecosystems around them. The area hosts some of the best solar sites in the nation.
“For a solar plant or facility, the higher the solar insolation, the more efficient the plant,” Flint says. “We all want that. So we have common ground there with the developers, environmentalists and the [governmental] agencies.”
Studying the footprints of solar projects — and much more — was the focus of a presentation by Anne Trainor, a postdoctoral ecologist at Yale University and Nature Net Fellow with the Nature Conservancy. Trainor and Joseph Fargione, the Nature Conservancy’s North America region director of science, looked at “how much land is possibly going to be needed to meet our future energy demands.” Trainor analyzed renewable energy, conventional energy and nonconventional energy sectors to predict the cumulative land-use impact between 2012 and 2040. She based her projections on data from the U.S. Energy Information Administration and previously published land-use observations.
Past “energy sprawl” studies have looked at single factors, like water consumption or emissions, or have focused on just coal, just renewables, or on broad energy sectors. Trainor’s study teases out different types and techniques — for example, separating shale gas from coalbed methane, or hydropower from wind turbines — to put the different energy sources onto “a single playing field and look at the complete energy portfolio,” she says. “By doing that, we can actually show policymakers that there are options in the future and that we should modify current policies to meet all of our energy needs while maintaining space for humans and for ecosystems.”
Based on her team’s calculations, Trainor estimates that about 200,000 square kilometers of additional area — about the size of South Dakota — will be needed to meet U.S. energy demands by 2040. This cumulative number for each energy source varies depending on several scenarios: no change in consumption amounts or sources (called “business as usual”), increased oil and gas production, improved renewable technology and carbon emissions reduction. The preliminary findings of the study show that, no matter the scenario, coal has the largest spatial impact. In the “business as usual” scenario, coal takes up an area of the land equivalent of Maine, whereas shale gas takes up an area equivalent to the size of Puerto Rico. Other nonconventional energy sources take up less space but could have more impact as the industry expands. Collectively, new hydropower, wind and solar will take up the equivalent land area of Hawaii. Biofuels are particularly land-intensive and, depending on how widely they are adopted and whether they are made from dedicated crops or from waste products, could require a footprint the size of Maryland.
Although these renewables have a significant impact, Trainor notes, “once they’re there, they can effectively collect energy in that one static location.” Unlike coal, oil and unconventional energy sources that will “be a continuously growing impact on the landscape” as they need more and more land for extraction.
In the end, “the overarching goal is that we’re working to mitigate climate change in the energy sector,” Flint says. “These plans take anywhere from 20 to 80 years to implement — these are long-term plans,” he says. Determining success is a long way out, but Flint says progress will show in “development proceeding as planned in the areas that you planned it — and in lockstep with that, you have the conservation that you planned occurring.”
To hear an audio clip of researchers discussing this research at the meeting, click here.
© 2008-2021. All rights reserved. Any copying, redistribution or retransmission of any of the contents of this service without the expressed written permission of the American Geosciences Institute is expressly prohibited. Click here for all copyright requests.