
by Max Wyss Friday, May 25, 2012
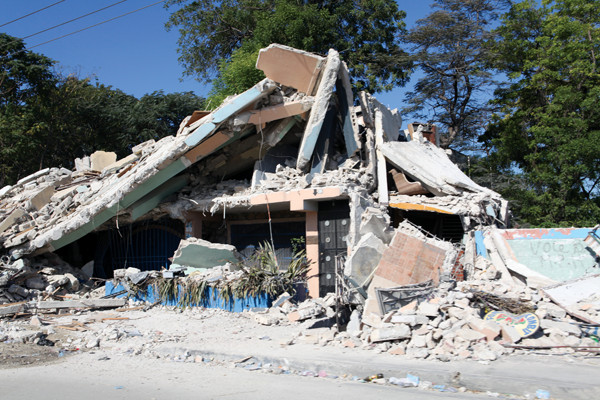
Adobe masonry, used throughout the developing world, often collapses in large earthquakes, including the 2010 quake in Haiti. Walter Mooney, U.S. Geological Survey
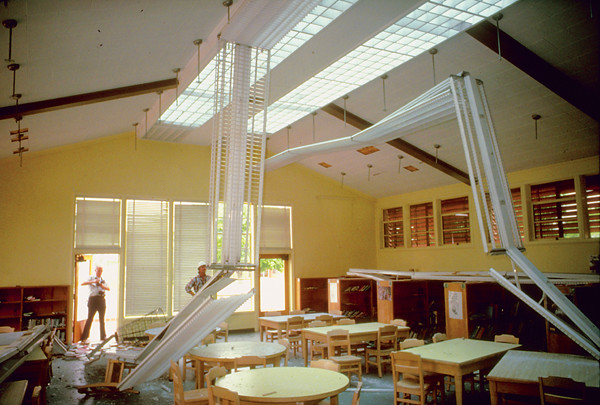
Schools tend to be especially vulnerable in earthquakes. A school in Coalinga, Calif., was damaged in a 1983 quake. Earthquake Engineering Research Institute, courtesy of NOAA National Geophysical Data Center
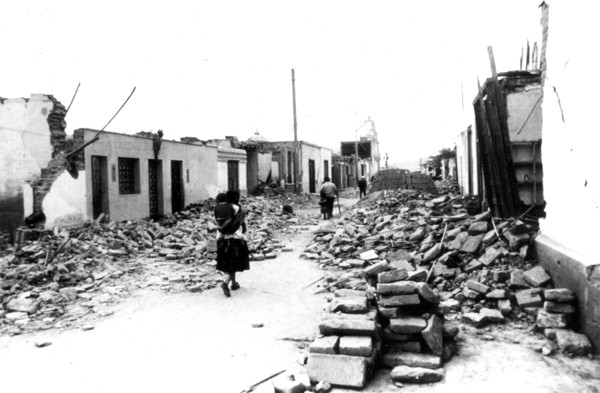
Much of Lima, Peru, was devastated in a 1974 earthquake. Some of the city has been rebuilt with earthquakes in mind, but even today if a large temblor were to strike the city, many buildings would likely collapse. U.S. Geological Survey
During the last decade, earthquakes have taken a heavy toll on lives, shocking the world. Two exceptionally large earthquakes off the coasts of Sumatra, Indonesia (December 2004), and Honshu, Japan (March 2011), generated tsunamis that swept more than 250,000 people to their deaths in total. In October 2005, a magnitude-7.6 earthquake devastated Pakistani Kashmir, collapsing buildings and triggering landslides that buried about 87,000 people. About the same number of people were killed in Wenchuan, China, in 2008, when the region was hit by a magnitude-8.0 earthquake. The number of fatalities is poorly known in Haiti from the 2010 magnitude-7.0 event near the capital Port au Prince, but it is suspected of killing 100,000 people and destroying nearly 300,000 buildings, including the national palace.
Although seismologists and engineers have generated a world map of seismic hazard, which shows the level of ground shaking likely not to be exceeded, all of these disasters were surprises: The ground motions and death tolls far exceeded expectations, causing consternation among the scientific community. The standard method to estimate seismic hazard has been brought into question and its assumptions and calculation methods have come under scrutiny.
Two measures speak to the level of potential danger from earthquakes: seismic hazard and seismic risk. Seismic hazard is defined as the likelihood that an earthquake will occur in a specific region over a specific period and that ground shaking will exceed a specific strength. Such probabilities are based on a region’s past earthquake activity and geology. Seismic risk then takes into account the harm or losses expected to result from the seismic hazard, including everything from the number of injured and dead to economic losses.
Seismologists have specific ways to identify seismic hazard worldwide, but whether or not the standard method is effective is a matter of vigorous debate. Seismologists can quantify expected seismic risk, but they seldom do it, and these estimates remain imprecise. Unfortunately, those details are what government officials in an earthquake-prone area need to know. To motivate public officials to invest in earthquake hazard mitigation, the officials need to know the number of casualties (fatalities plus injured) expected in their jurisdiction.
Until now, only rough estimates of human losses have been possible. Unfortunately, massive challenges underlie these estimates. First and foremost is that current seismic hazard maps, which provide the basis of risk estimates, lead to underestimates of the casualties by more than two orders of magnitude. Hence, relying on these maps, communities were unprepared in Kashmir and Wenchuan, where killer earthquakes wiped out schools, hospitals and residences, killing and injuring hundreds of thousands of people.
If earthquake prediction were possible, the political will to protect the population would be found. However, there is no reliable method available to predict earthquakes. So, seismologists do the next best thing: They determine where evidence exists for an increased probability for large earthquakes. We know the location of most of the active faults that generate large earthquakes. For some well-studied faults, we also know the sizes of past ruptures and their approximate frequencies.
It is clear that the same faults repeatedly rupture in large earthquakes, but the intervals between them vary greatly. Thus, we have a pretty good idea of the magnitude of the maximum size earthquake that a fault is capable of, but we have only a vague idea of when the next one will occur. (We can also be wrong: For example, only magnitude-8.0 events were expected off the coast of Honshu, where the magnitude-9.0 Tohoku quake occurred in March 2011.)
Clearly, it is crucial to know the probability that a certain location will be strongly shaken by an earthquake in the future. Where earthquakes have never occurred in history, the motivation for costly mitigation measures is nonexistent. But in seismogenic areas, the motivation to mitigate earthquake impact should be high. We start with estimating the seismic hazard — something some scientists will argue that we do well, but others disagree. What’s wrong with the standard method of estimating the seismic hazard? In a recent issue of the journal Pure and Applied Geophysics, a host of technical articles detailed weaknesses and even errors in the method of assessing seismic hazard.
The basic assumptions for calculating the seismic hazard at any given point are: There are seismic sources (either a well-defined active surface fault or a seismogenic volume throughout which earthquakes happen in a disorganized way) distributed at various distances around the site; each of these sources is capable of generating an earthquake of estimated maximum magnitude, but not larger; and it is assumed that the annual probability of this largest, and most important, earthquake for each source can be extrapolated from the observed small magnitude events. In other words, for 10 earthquakes of magnitude M, one event of magnitude M+1 occurs. That means the assumption is that the probability of a large earthquake is proportional to the local rate of small earthquakes.
This method of calculating the seismic hazard uses estimates from a variety of points, with the contributions of sources closest to the site weighted more heavily than distant sources. This is called the probabilistic approach to seismic hazard assessment. In most parts of the world, this is the limit of the effort for identifying a location’s likelihood to experience strong shaking due to an earthquake.
The seismic hazard is generally depicted in color-coded maps that indicate how much shaking, or acceleration, is likely in a given area over a 50-year period. The world seismic hazard map generated by the Global Seismic Hazard Assessment Program (GSHAP) defines the hazard in colors from dark red and orange, to green and blue. The project Global Earthquake Model (GEM) is currently working on a new such map, using new data, but still relies on the probabilistic approach.
In earthquake-prone areas, buildings in which people live and work should be constructed to resist strong shaking. Seismic zonation maps indicate the relative earthquake danger in countries and in parts of large cities separately. These maps serve to define the level of resistance to shaking to which buildings should be designed. However, such maps are often based on expert judgment alone, instead of quantitative analysis.
Building codes give detailed conditions according to which buildings must be constructed. In many countries, these codes were introduced or amended starting in 1970. Most structures in which people live and work were erected before this time and are not subject to the regulations. Adherence to the codes is also impacted by local regulatory enforcement.
Together with my colleagues at the International Institute of Earthquake Prediction Theory and Mathematical Geophysics at the Russian Academy of Sciences in Moscow, I quantitatively evaluated the usefulness of standard seismic hazard maps based on the comparison of losses predicted by the GSHAP map with losses sustained in disastrous earthquakes.
As test cases, we used the 12 earthquakes that caused more than 1,000 fatalities during the last 10 years. The three that each killed almost 100,000 people by collapsing buildings were the 2005 Kashmir magnitude-7.6, the 2008 Wenchuan magnitude-8.0, and the 2010 Haiti magnitude-7.0 earthquakes. The numbers of fatalities are used as a parameter to measure the seriousness of each disaster because it is better known than the numbers of injured and the monetary losses. We also use the number of “affected” people as a measure of the disaster level. Affected people are defined as the sum of the population living in the area in which the calculated damage was at least minor (cracks in buildings).
The computer tool that calculates losses, called QLARM, contains population data for 2.6 million cities, towns and villages, accounting for every country in the world. To characterize the performance of buildings under strong shaking, the European Macroseismic Scale is commonly used. It recognizes six types of buildings, from A, the weakest, constructed of rubble stone or adobe, to D, built with reinforced concrete and typical in industrialized countries, to F, the most shaking-resistant design, using steel structures.
In our model for the built environment, the distribution of buildings into construction types is specific for three settlement sizes in each country. The limits separating the small and large ones from the medium-sized ones are typically populations of 2,000 and 20,000. In industrialized countries with enforced building codes, the weakest types (A and B) are virtually absent, whereas they abound in developing countries.
We use casualty matrices to estimate the percentages of fatalities, injured and unscathed among occupants of collapsing buildings. These matrices are very different in the industrialized and in the developing world. In a study published in 2011 in “Human Casualties in Natural Disasters: Progress in Modeling and Mitigation,” I showed that the chances of survival in a building subject to strong shaking in an industrialized country are typically 50 times better than in a developing country. Finally, we also use the regional attenuation of seismic waves as an additional parameter that varies and influences the amount of damage. These parameters are calibrated using observations from past earthquakes.
We put the theory underlying the GSHAP calculations to the test by comparing the numbers of fatalities that were sustained in the 12 recent killer earthquakes with the numbers reasonably expected based on the world seismic hazard map. Taking the point of view of a city official who wants to know what will happen if the maximum likely shaking, or acceleration, occurs as specified on the GSHAP map, we asked the question: What magnitude earthquake, located at the observed epicenter, would generate the acceleration specified on the GSHAP map for that point and what would the casualties be in that case? We found that the observed magnitudes were 1.9 units larger than the expected magnitudes, on average. Because the magnitude scale is logarithmic and based on the amplitudes of seismic waves, this means that the observed shaking was about 100 times stronger than expected. This corresponds to approximately a 1,000-fold underestimate of the radiated energy by the GSHAP map.
Even more importantly, we found that the ratio of observed to expected fatalities (and number of people affected) derived from the GSHAP map is approximately 160 to one, on average. This means that on the basis of GSHAP, one would have expected about 500 fatalities in cases where the observed number turned out to be about 87,000, as in the case of the Wenchuan earthquake.
In addition, instrumental measurements of accelerations show that the GSHAP map underestimates the seismic hazard on average by a factor of three. In a 2011 paper in Pure and Applied Geophysics, Elisa Zuccolo, now at the University of Pavia in Italy, and her colleagues reported that in all six available comparisons, the measured accelerations were larger than those specified on the GSHAP map.
Earlier this year, Vladimir Kossobokov, of the Institute of Earth Physics of Paris in France and the Russian Academy of Sciences, and Anastasia Nekrasova, also of the Russian Academy of Sciences, published an article in Seismic Instruments in which they showed that in an overwhelming majority of magnitude-7.0 and larger earthquakes worldwide, the observed maximum intensities of shaking were much larger than expected based on the GSHAP map.
Together, our results, the ones by Kossobokov and Nekrasova, and those by Zuccolo and colleagues suggest that the GSHAP map and the method for calculating seismic hazard underestimate the seismic risk because they vastly underestimate the damage. With such strong underestimates of the earthquake danger, motivation for mitigating the risk is greatly reduced.
An additional issue is that a map that depicts the seismic hazard in ground acceleration is only useful for engineers who design a critical facility, such as a power plant, high reservoir dam, hospital or bridge. Because it’s not framed in risk, but rather hazard, it’s not useful to an official who needs to decide whether to allocate part of a city’s limited resources for mitigation.
For critical facilities — for example, high reservoir dams — the seismic hazard is investigated in great detail. Where the seismicity record is poorly defined, local seismograph networks are installed to gather data before the hazard analysis can be performed and the dam can be designed and erected. Although the standard probabilistic seismic hazard analysis as defined above is primarily used, the deterministic concept of the acceleration expected from the maximum credible earthquake constitutes an important part of the hazard assessment. “Deterministic” means that the expected shaking is calculated from a single earthquake, the one that will produce the strongest shaking at the site in question.
For this calculation, seismologists need to estimate the magnitude of the largest earthquake each fault in the vicinity of the dam is capable of producing. The parameters of a fault rupture that determine its size are rupture length, width and the amount of slip. The maximum credible values for these combine to yield the maximum credible magnitude. The requirement for the dam design is that the structure must be strong enough so it will not collapse in the worst case, namely if the maximum credible accelerations occur. But the hazard for most cities is not investigated to nearly the same thorough level, and their built environment is not subjected to the same requirements. If critical facilities deserve this level of precaution, why not population centers?
In population centers, the monetary losses are larger than in the case of critical facilities, and the number of possible fatalities and injured is staggering, as we have seen in Haiti, Kashmir and Wenchuan. Until now, the human losses that may be sustained in a maximum credible earthquake in the developing world have been estimated for only a handful of population centers, such as Teheran, Iran, and Lima, Peru, for example. However, more than 1,000 major cities are at risk and need this information.
Investigating the risk for megacities can be very expensive. However, using basic information on populations and building stock from censuses, one can construct a risk map that is still useful for mitigation and civil protection exercises. For example, using this basic information, we estimated the percentage of the population that may die in a great earthquake located directly offshore Lima.
How serious the earthquake problem is for megacities like Lima can be understood when one considers that the population is about 12 million, and, depending on the building quality, the soil conditions, and the distance from the earthquake, the number of fatalities in different districts may range from 0.5 to 4 percent— a potential death toll of 60,000 to 480,000. The looming problem is most dramatically demonstrated by our calculations of the likely fate of the children: In a worst-case scenario of a magnitude-8.5 earthquake close to the city, one must expect that about 20,000 children, about 2 percent of the 1 million school-aged population, will probably die, and a multiple of this number will be maimed for life.
The chief criticism voiced in the special issue of Pure and Applied Geophysics is that the probabilistic seismic hazard approach should be replaced by a deterministic or a hybrid approach. For the purposes of insuring buildings, the probability of a given level of shaking must be estimated, so that the probability of a resulting degree of damage can be calculated. Otherwise insurance rates cannot be determined. We would argue that for the basis of a plan to protect the population from earthquake consequences, the same strict requirements should be applied as for critical facilities: the worst credible case, which is calculated deterministically.
The resources available to mitigate future earthquake disasters are limited, especially in the countries that need them most, where other pressing issues such as hunger, health, education and civil unrest may also persist. Without a calculation of the probability of the maximum credible event, government officials may be justified in assuming that the disaster will not happen on their watch, and therefore allocating funds to other problems instead.
Deterministic calculations of expected ground shaking are straightforward, but they require expert judgment regarding the expected earthquake and they usually lack a rigorous estimate of the probability with which the dreaded event may occur. Some information on the probability of a repeat earthquake might come from detailed paleoseismic and geodetic investigations of the faults expected to generate the maximum credible earthquakes. From excavations of past fault slips, seismologists can get a good idea of past magnitude events along capable faults, a rough idea of the repeat time and its variation, and the year when the last large rupture happened. From measurements of the crustal deformations near the fault by GPS or InSAR (radar) methods, we can determine the rate at which the fault is loaded. Combining these two pieces of information, we can calculate an approximate probability for the next large event. Using this information, we can get a better idea of the likelihood of the worst-case scenario.
The problem of estimating hazard and risk in a useful way is complex and currently hotly debated. Two recent volumes of Pure and Applied Geophysics are devoted to articles that criticize and point out errors in the assumptions and mathematics that go into the standard probabilistic hazard analysis. Correcting the shortcomings is not an easy matter because the method is required by law in some countries. Nevertheless, a few obvious steps toward a solution may be proposed.
First, the methods of deterministic and neo-deterministic hazard assessment, as advocated by Giuliano Panza of the University of Trieste in Italy and colleagues in Pure and Applied Geophysics, should be tested to see how closely they predict the measured accelerations reported by Zuccolo and colleagues and the observed intensities collected by Kossobokov and Nekrasova. Second, the fatalities predicted on the basis of the hazard estimated by the new methods should be compared to the observed ones, as we have done for the GSHAP values. That will give us an idea of how the models perform.
Third, the basic assumption that the frequency of great earthquakes can be extrapolated from the frequency of small earthquakes should be examined in cases where the average return time of the great earthquake is known. This assumption is incorrect for important faults in California and Alaska, for example. Fourth, the seismic risk should be calculated for all major population centers deterministically.
Finally, and most importantly, seismic risk estimates need to be taken outside the research community and prepared in such a way that the population can benefit. Risk estimates should be formulated understandably for the decision-makers who need the information in a format they can understand.
To achieve this, seismologists and engineers have a long way to go. To begin with, we have to determine how to best calculate seismic hazard and come up with a method that works reliably. Next, the risk to the population has to be calculated, such that governments can decide on an informed basis where mitigation is needed. The data for this are currently inadequate. Both the population numbers and the resistance to shaking of the built environment are generally poorly known. In addition, the method to estimate expected casualties due to future earthquakes is still in a rudimentary stage. For example, data on how people die in buildings are inadequate, so assumptions have to be made.
This is a time in hazard and risk seismology when new approaches are needed. Moving toward the new approaches will not be easy because the inadequate methods have become entrenched by practice over decades. Nonetheless, it’s necessary to save lives.
© 2008-2021. All rights reserved. Any copying, redistribution or retransmission of any of the contents of this service without the expressed written permission of the American Geosciences Institute is expressly prohibited. Click here for all copyright requests.