by Timothy Oleson Monday, December 8, 2014

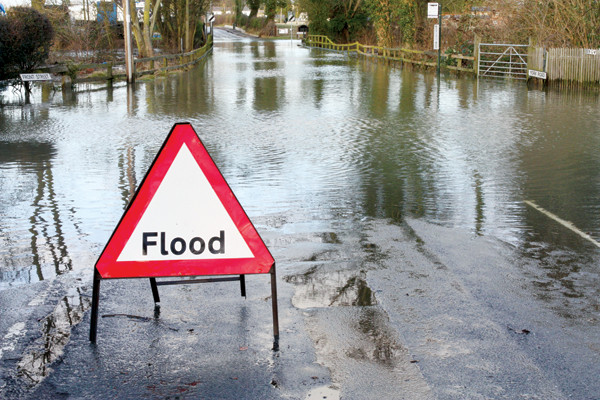
Terms like "100-year flood," which designate return periods for events like floods, storms and droughts, may not be the best way to communicate the risk they pose. Credit: ©Shutterstock.com/northallertonman.
The “100-year flood” is a familiar term to anyone who lives in a flood-prone area or has ever looked at a flood map before buying homeowner’s insurance. Return periods, or recurrence intervals, like this are standard parlance for describing the magnitude and potential hazard of floods, as well as other hydrologic events like storms and droughts. Although such terms have long helped policymakers and the public try to make sense of severe weather, one researcher suggests they may confuse the issue more than clarify it.
Return periods refer to the amount of time that passes on average between consecutive events of similar magnitude for a given location. “The famous 100-year flood is the flood that’s exceeded on average once every 100 years,” meaning “it has a 1 percent chance of occurring in any given year,” says Richard Vogel, a hydrologist at Tufts University in Medford, Mass.
But when it comes to communicating potential risk from flooding, Vogel says, return periods, widely used in hydrology, give many people a false sense of security, partly because they are often mistaken as absolutes instead of averages. Also, people can easily misconstrue the short- and long-term likelihoods of a severe event occurring. A 1 percent chance of a 100-year flood occurring in a given year, for instance, doesn’t equate to a 1 percent chance that such a flood will happen during a 100-year period. Rather, he notes, if you calculate the actual probability, “there’s a 64 percent chance you’re going to see something bigger than that in the next 100 years.”
Vogel spoke about potential revisions to traditional approaches during a session at the 2014 annual meeting of the European Geosciences Union in Vienna, Austria, last May. Instead of return periods, he says, most fields that deal with the probabilities of potential catastrophes occurring — natural, financial or otherwise — talk in terms of reliability, or the odds that a catastrophe will not occur within a given time frame.
Earthquake engineers, for example, relate the strength of new buildings to ground shaking from the “maximum considered earthquake” in an area, which has a 2 percent chance of being exceeded in a 50-year period. That equates to 98 percent reliability that such an earthquake will not happen within the 50-year time frame (equivalent to protecting against an earthquake with a 2,475-year average return period). Similarly, he says, financial planners often use simulations and models to ensure with 95 percent reliability that their clients’ retirement funds will be solvent over a 30-year period.
“We want to be sure in an uncertain world, so [these industries] talk about reliabilities over long periods of time,” Vogel says. “We should be doing that for floods; it turns out if you tell somebody they’re protected against a 100-year flood … your reliability is only 36 percent” over the next century.
Another problem is that, in a world of changing climates and increasing development, return periods — often based on records dating back less than a century — for a particular magnitude event can also change over time. When flood maps are made with boundaries denoting 100-year-flood and 500-year-flood boundaries, as they typically are, “they really should have a date in the corner that says this map is for [a particular year], and it could change next year,” he says.
In a 2011 study in the Journal of the American Water Resources Association, Vogel and his colleagues examined decades-long records from thousands of U.S. streamgages nationwide, and found that average streamflows and flooding in many areas had increased greatly, two- to three-fold per decade since the mid-20th century (the duration of the streamgage records varies from station to station). The most dramatic increases were seen in large urban areas — in the Northeast and coastal California, for example — suggesting the changes resulted primarily from urbanization.
“As cities and towns become more paved, the size and frequency of floods go up very quickly,” he says. “But remarkably, there are no standard approaches for correcting for urbanization when estimating the 100-year flood.”
Considering the confusion over the term’s meanings, and that return periods and recurrence intervals for floods, storms and droughts aren’t static, Vogel says, “it becomes very misleading … to tell people the average time they have to wait until the next flood.”
© 2008-2021. All rights reserved. Any copying, redistribution or retransmission of any of the contents of this service without the expressed written permission of the American Geosciences Institute is expressly prohibited. Click here for all copyright requests.