
by Bethany Augliere Tuesday, July 18, 2017
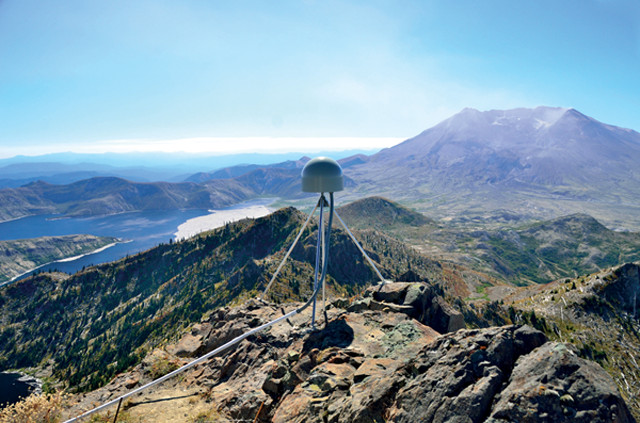
Geologists have adapted a financial algorithm developed for stock trading to identify slow-slip events from single GPS stations, such as this one on Coldwater Peak just north of Mount St. Helens. Credit: Mike Gottlieb, UNAVCO.
Traders in financial markets use a variety of computer algorithms to help them decide when to buy or sell different stocks. Geologists have now adapted one of these algorithms to improve detection of subtle slow-slip events along faults, paving the way for a better understanding of regional seismic hazards.
Earthquakes typically last seconds to minutes, causing the ground to shake and releasing stored stress along faults by generating seismic waves, which can be measured with seismometers. Slow-slip events, in contrast, happen over weeks to months as tectonic plates very gradually move against one another. Although slow slip — first observed in the 2000s — isn’t dangerous on its own, it’s thought to load stress onto the massive subduction zone faults where it’s mostly known to occur. Slow slip is “silent,” meaning it doesn’t generate enough seismic activity to be picked up by seismometers. Instead, the slip has conventionally been detected by comparing measurements from multiple GPS stations.
Scientists looking to streamline the detection and analysis of slow-slip events turned to a financial indicator called the relative strength index (RSI). Developed in the late 1970s, the RSI tracks the momentum of a particular stock based solely on changes in its price through time, without considering other variables such as stock volume or volatility. The output, on a scale from zero to 100, offers a quick indication of whether a stock might be overbought or oversold (if its RSI is high or low, respectively).
“It doesn’t matter if it’s a stock price, or a GPS [location moving slightly over time], this [tool] works on any time series,” says Brendan Crowell, a geophysicist at the University of Washington and lead author of a new study, published in the Journal of Geophysical Research: Solid Earth. This simplicity is largely why Crowell and his colleagues chose it over other algorithms. Additionally, using the RSI, slow-slip events can be detected from a single GPS station, he says. Until now, detecting slow-slip events required analyzing data from dozens of stations.
The modified RSI works by tracking slight horizontal and vertical ground motions in GPS data that could be associated with slow slip. If there is no net ground motion over a period of time, the RSI is 50. Values above or below 50, however, imply sustained motion in a particular direction, and recent GPS data can be analyzed to assign a probability that this motion is related to a slow-slip event.
“The most exciting part of the study is the novelty of the idea,” says Noel Bartlow, a geologist at the University of Missouri, who was not involved in the research. “It’s a fundamentally different method from anything that’s already been tried.”
Crowell and his colleagues used the algorithm to analyze data collected between 2005 and 2016 from 213 GPS stations along the Cascadia Subduction Zone, which stretches from Northern California to Canada’s Vancouver Island. “I needed to fully validate the algorithm, and using Cascadian slow slips was the easiest way to do this because they are so well-studied,” he says.
These silent episodes of fault motion are accompanied by occasional bursts of small vibrations, or tremors, which reverberate to the surface but are too small to register on seismometers. Crowell and his team mapped progressions of tremors that occurred in the dataset using single-station RSIs, and their findings matched the patterns of detected slow-slip events reported in other studies over the past 12 years.
Crowell says he wasn’t expecting the method to work as well as it did. “The fact that we were able to reconstruct the whole progression of some of these events before validating with past studies and other datasets was pretty remarkable,” he says. By providing quicker, real-time data, the new technique should allow for a better understanding of the seismic hazard in such areas, Crowell says.
Previous studies have suggested that slow-slip events can precede large earthquakes, and in some areas these episodes occur regularly. Along Cascadia, for example, slow-slip events happen every 12 to 18 months. It’s important to monitor slow-slip behavior because modeling results indicate that slow-slip “intervals, depths or amplitudes may systematically change with time as the next large earthquake approaches,” Bartlow says. “An automated detection algorithm would greatly advance that effort.”
Crowell and Bartlow both say the technique could be applied beyond Cascadia, and Bartlow would like “to see if it can help identify slow-slip events that were not previously recognized” in other regions. Crowell notes that it could be particularly useful for detecting slow-slip events beneath places like the South Pacific, for example, where there is often just a single GPS station on an island.
© 2008-2021. All rights reserved. Any copying, redistribution or retransmission of any of the contents of this service without the expressed written permission of the American Geosciences Institute is expressly prohibited. Click here for all copyright requests.